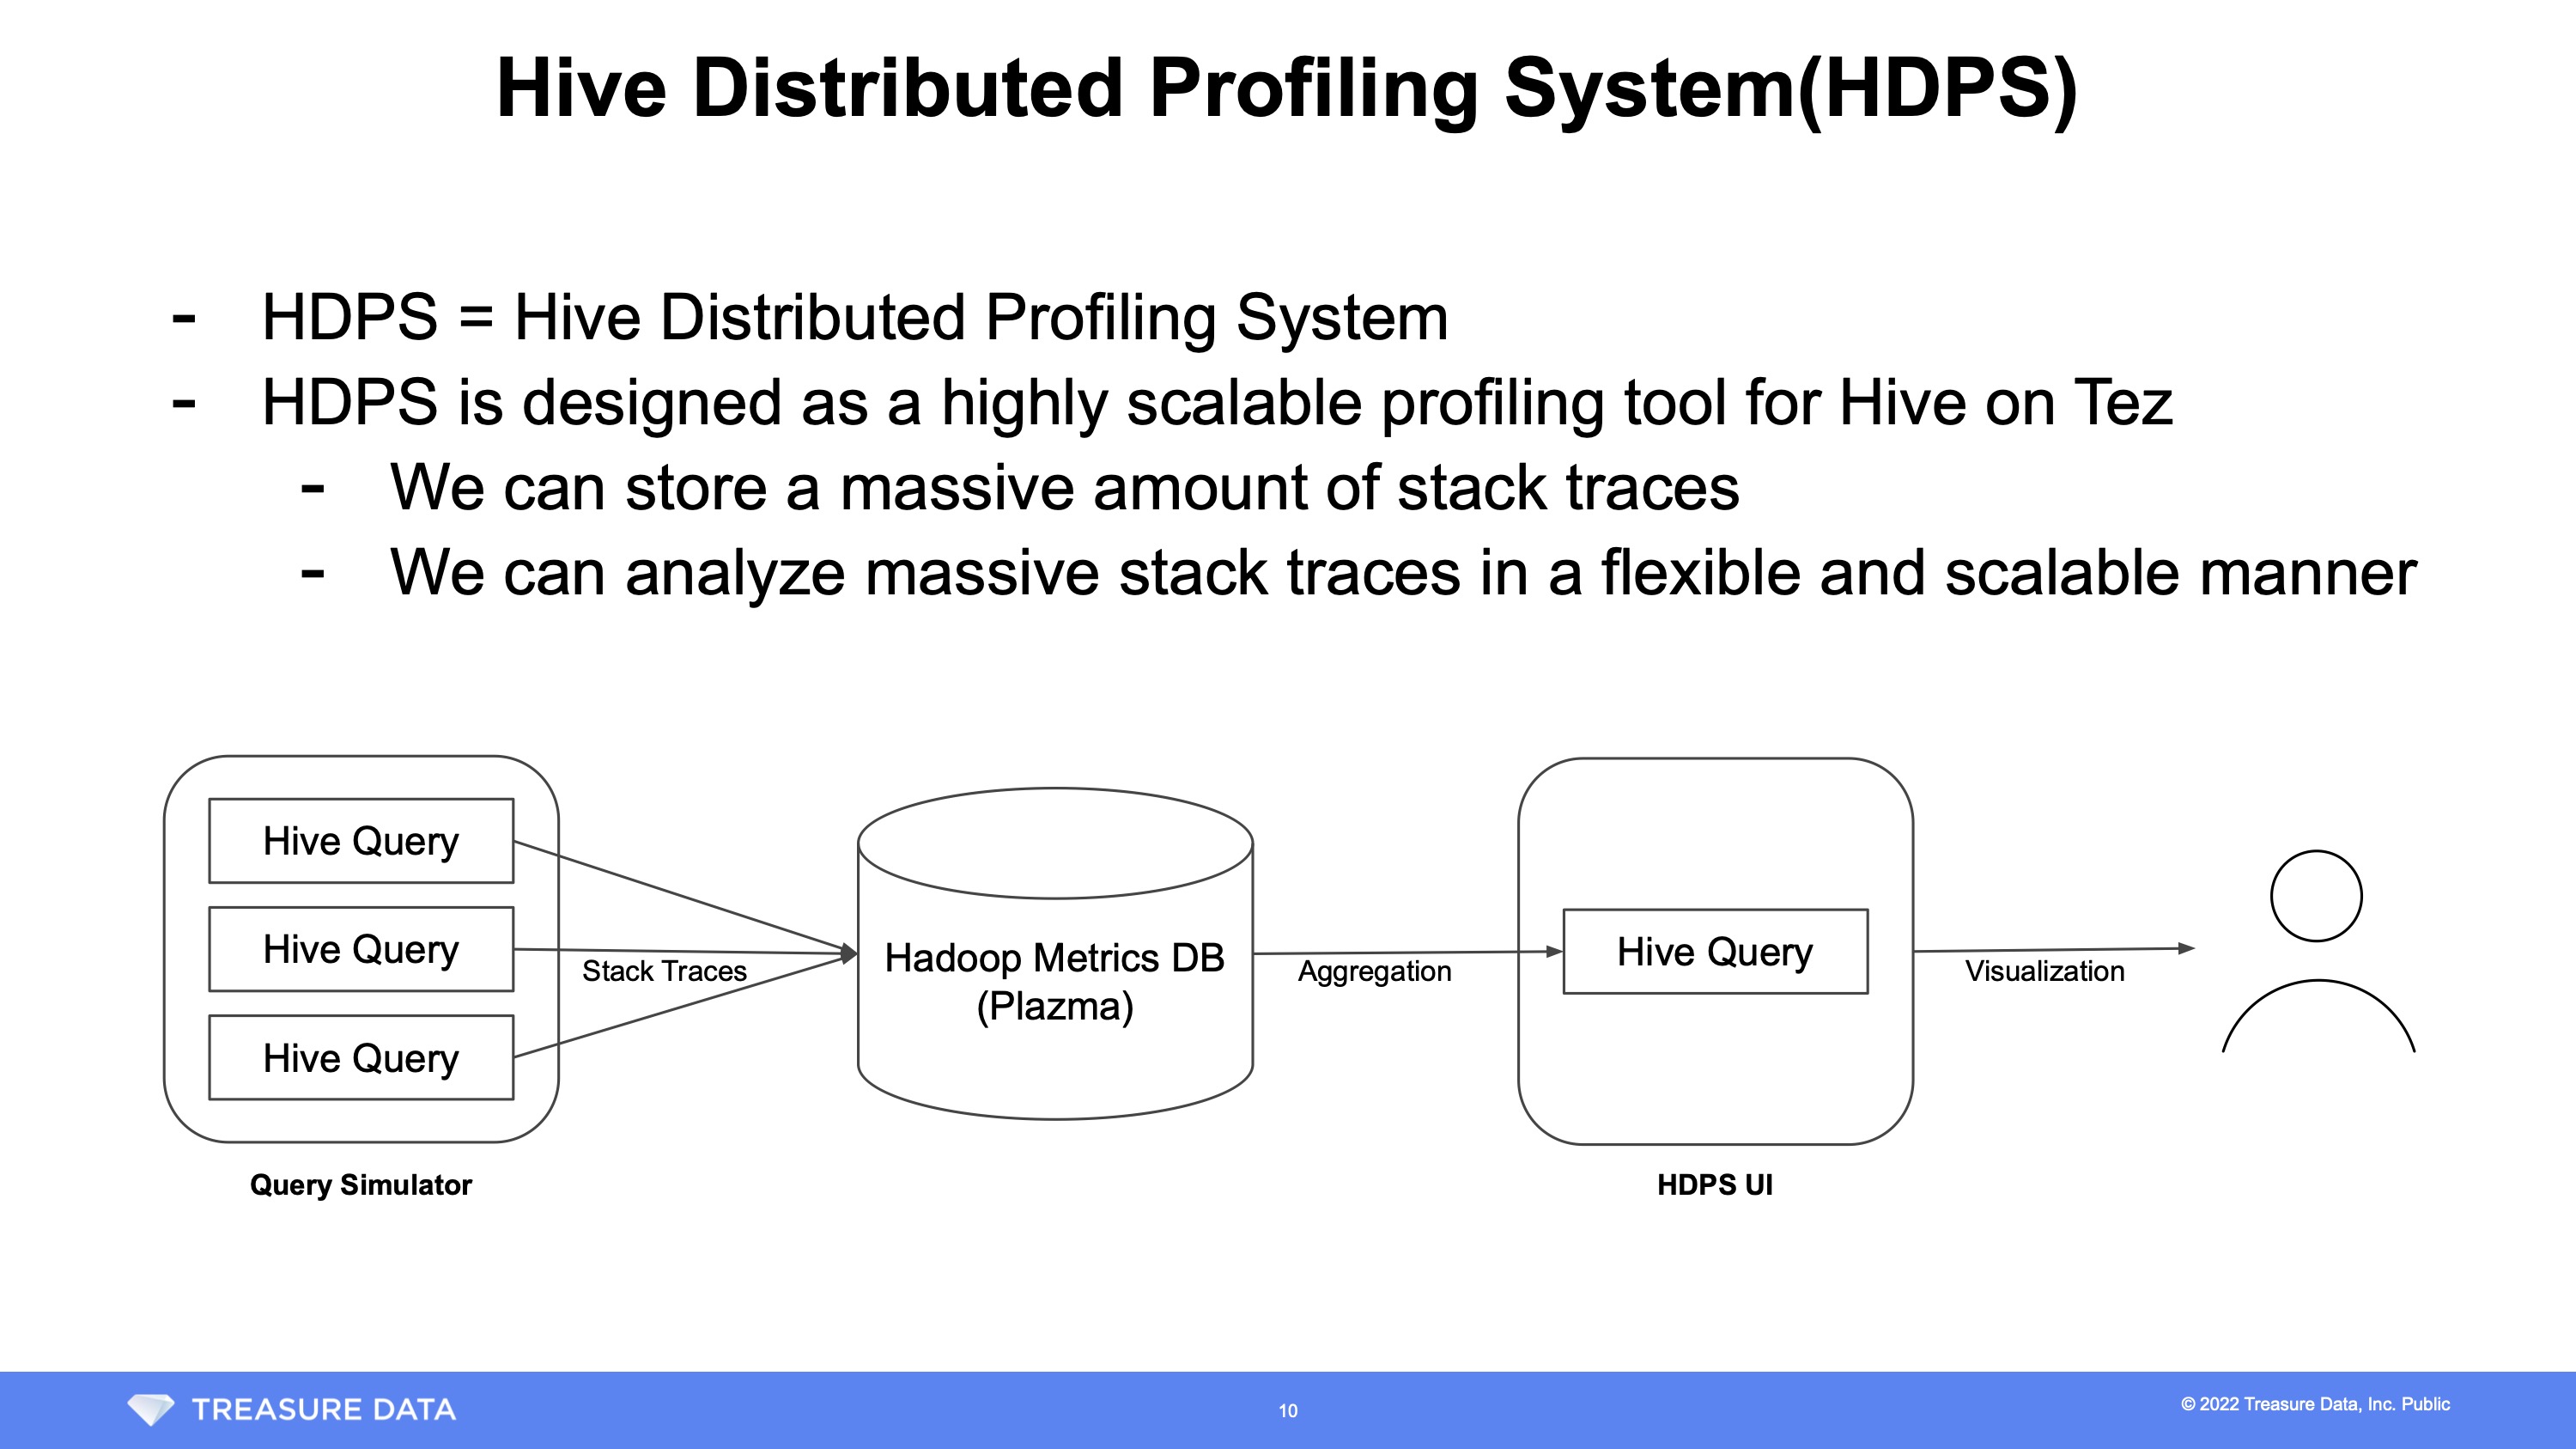
This post covers how Treasure Data implemented profiling with stack traces to enable a infinitely scalable and unrestricted analysis with Hive.
This blog post is a translation of work done by @Okumin (Shohei Okumiya) during the 2022 Treasure Data Tech Talks in Japan.
<center>
Turn on captions and set the Auto-translate function to your language of choice.
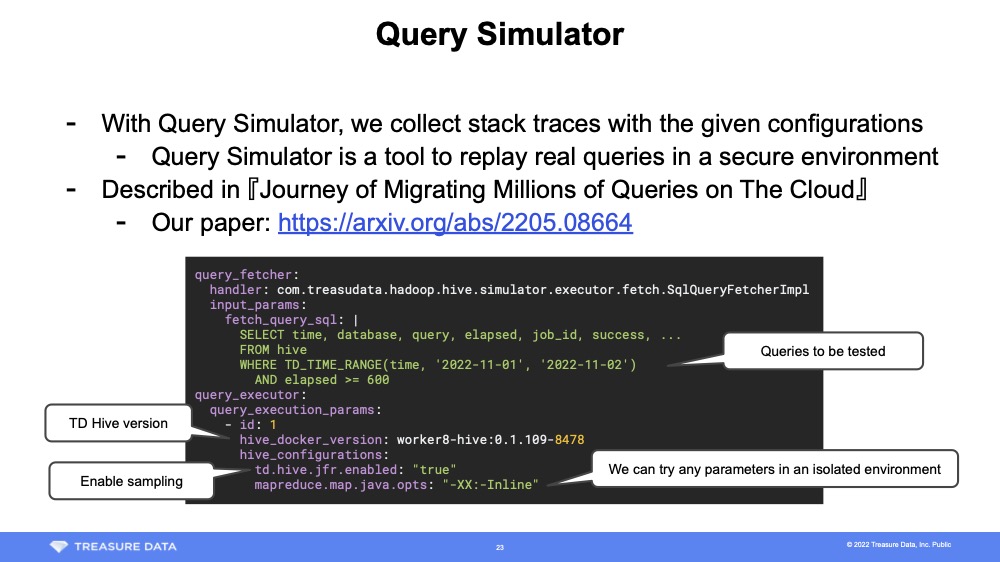
The query simulator depends on various systems that are not availableto the general public, so they are beyond the scope of this blog post. For more information, see Journey of Migrating Millions of Queries on The Cloud.
The query simulator is largely a tool of convenience for the Treasure Data platform. While it is incredibly useful for our customers it is not necessarily required to implement HDPS.
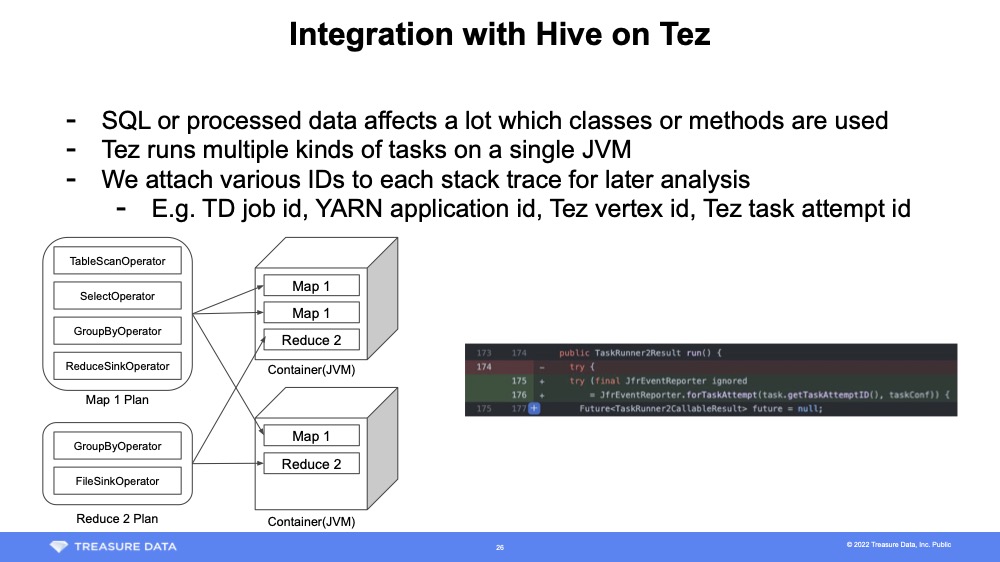
When using a profiler, it is common to sample stack traces for each process. HDPS, on the other hand, uses the Java Flight Recorder Java API to sample in Tez Task Attempt units. To use it, apply the following patch to Tez's TezTaskRunner2.
public TaskRunner2Result run() {
   try ( final JfrEventReporter ignored = JfrEventReporter.forTaskAttempt(task.getTaskAttemptID(), taskConf)) {
     // Block to execute Task Attempt and wait for completion
    ...
  }
}
Each time Task Attempt is executed, the following process is called. Please note that some error checking, such as handling of abnormal systems, has been omitted for clarity. By leveraging JFR Event Streaming (introduced in Java 14) the implementation is fairly straightforward.
public  class JfrEventReporter implements Closeable {
   private  final Recording recording;
   private  final Path dumpFile;
   private  final LinkedHashMap<String, Object> identities;

  public  static JfrEventReporter forTaskAttempt(TezTaskAttemptID taskAttemptID, Configuration conf) {
     if (!conf.getBoolean( "td.hive.jfr.enabled" , false )) {
       return  new NopJfrEventReporter();
    }

    // Store Hive or Tez IDs
    final LinkedHashMap<String, Object> identities = new LinkedHashMap<>();
    identities.put( "hive_session_id" , conf.get( "hive.session.id" ));
    identities.put( "application_id" , taskAttemptID.getTaskID().getVertexID().getDAGId().getApplicationId().toString());
     ...

    final Map<String, String> settings = ImmutableMap
        .<String, String>builder()
        .put( "jdk.ExecutionSample#enabled" , "true" )
        .put( "jdk.ExecutionSample#period" , "100ms" )
        .put( "jdk.NativeMethodSample#enabled" , "true" )
        .put( "jdk.NativeMethodSample#period" , "100ms" )
        .build();
    final Recording recording = new Recording(settings);

    final Path dumpFile = Files.createTempFile( "td_" , ".jfr" );
    recording. setToDisk( true );
    recording.setDestination(dumpFile);
    recording.start();

    return  new JfrEventReporter(recording, dumpFile, identities, ... );
  }

  private JfrEventReporter( ... ) {
     // initialization
    ...
  }

  @Override
  public  void close() {
     this .recording.stop();
     this .sendEvents();
    Files.deleteIfExists(dumpFile);
  }

  private  void sendEvents() {
     final RecordingFile file = new RecordingFile(dumpFile);
     while (file.hasMoreEvents()) {
      sendEvent(file.readEvent());
    }
  }

  ... .
}
For Hive on Tez this is all you need to map stack traces and their associated IDs as there is only one Task Attempt processed at a time in the Tez container. Since the processing is completed in the Tez process, there is no need to modify YARN and it is easy to deploy. When profiling different middleware, additional strategies may be required depending on the execution model of processes and threads.
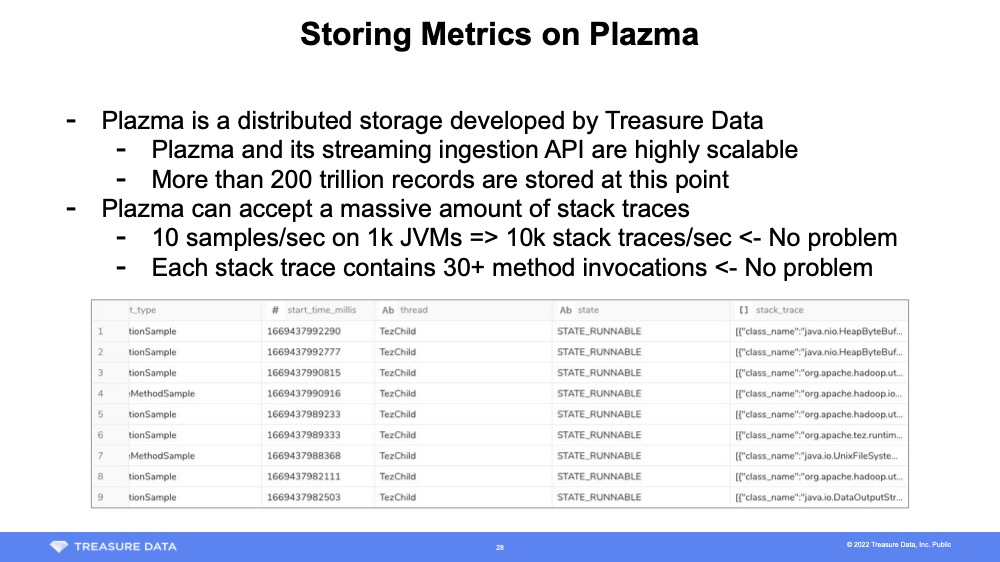
A Fluentd process resides on the TD server, and it is set up to automatically add a record to the TD table when an event is sent to a specific tag. It is a very convenient system that automatically detects schema changes. This allows you to store various metrics as if you were doing an RPC. Using this mechanism, the stack trace required for HDPS analysis is sent appropriately.
private void sendEvent (RecordedEvent event ) {
final String thread = event.<RecordedThread>getValue( " sampledThread" ).getJavaName()
; " )) {
return ;
}
final LinkedHashMap<String, Object> record = new LinkedHashMap<>(identities);
record.put( "stack_trace_id" , UUID.randomUUID().toString());
record.put( "event_type" , event.getEventType().getName());
record.put( "start_time_millis" , event.getStartTime().toEpochMilli());
record. put( "thread" , thread);
record. put( "state" , event. getString( "state" ));
record.put( "stack_trace" , formatStackTrace(event.getStackTrace()));
// Just send it to Fluentd prepared by the SRE team
fluency.emit( "tag.to.hadoop_metrics.tez_task_attempt_method_sampling" , event.getStartTime().getEpochSecond(), record);
}
private static List<LinkedHashMap<String, Object>> formatStackTrace(RecordedStackTrace stackTrace) {
return stackTrace.getFrames().stream().map(frame -> {
final LinkedHashMap<String, Object> element = new LinkedHashMap<>();
element.put( "class_name" , frame.getMethod().getType().getName());
element.put( "method_name" , frame.getMethod().getName());
element. put( "line_number" , frame. getLineNumber());
element.put( "is_java_frame" , frame.isJavaFrame());
element.put( "type" , frame.getType());
return element;
}).collect(Collectors.toList());
}

HDPS uses d3-flame-graph to generate flame graphs. The d3-flame-graph takes recursive JSON and draws a flame graph.
{
  " name ": " <method name or number of lines> ",
  " value ": < number_of_times_sampled >,
  " children ": [
    < object >
   ]
}
Generating this JSON from a large stack trace using JavaScript is impractical. Therefore, the HDPS Web UI automatically generates the following SQL according to the analysis conditions and forcibly aggregates it using Hive. In fact, the JOIN and WHERE clauses in the Common Table Expression on lines 5 and 6 are incredibly powerful and are introduced in "How to accumulate TD job information, execution plans, and metrics of Hive on Tez in any data base - Okumin Official Blog." It narrows down the analysis target while combining the metrics that are used.
01:  -- Narrow down the stack traces to be analyzed
02:  WITH sampled_stack_traces AS (
03:     SELECT stack_trace_id, ARRAY_APPEND(stack_trace, ' {} ' ) AS stack_trace
04:     FROM tez_task_attempt_method_sampling AS t
05:     JOIN other_metrics ...
06:     WHERE {condition}
07:  ),
08:  --
09:  frames AS (
10:     SELECT
11:      stack_trace_id,
12:      IF (
13:        frame = ' {} ' ,
14:         ' <ROOT> ' ,
15:        GET_JSON_OBJECT(frame, ' $.class_name ' )
16:          || ' . '
17:          || GET_JSON_OBJECT(frame, ' $.method_name ' )
18:          || ' :   '
19:          || GET_JSON_OBJECT(frame, ' $.line_number ' )
20:          || ' ( '
21:          || IF (GET_JSON_OBJECT(frame, ' $.type ' ) = ' Native ' , ' Native ' , ' Non-native ' )
22:          || ' ) '
23:      ) AS line,
24:       SIZE (stack_trace) - pos AS  depth
25:    FROM sampled_stack_traces
26:    LATERAL VIEW POSEXPLODE(stack_trace) t AS pos, frame
27:  ),
28:  -- reconstruct and aggregate
29:  prefix_frequency AS (
30:     SELECT frame_path, SIZE (frame_path) AS  depth , COUNT (*) AS num
31:     FROM ( SELECT COLLECT_LIST(line) OVER (PARTITION BY stack_trace_id ORDER  BY  depth ) AS frame_path FROM frames) AS t
32:     GROUP  BY frame_path
33:  )
34:  SELECT p.frame_path[ depth - 1 ] AS node, p. depth , p.num, ROW_NUMBER() OVER ( ORDER  BY p.frame_path) AS sort_id
35:   FROM prefix_frequency p
36:   CROSS  JOIN ( SELECT  count (*) AS num FROM sampled_stack_traces) t
37:   -- Remove minor nodes so d3-flame-graph draws smoothly
38:  WHERE p.num * 100.0 / t.num >= 1.0
39:  ORDER  BY sort_id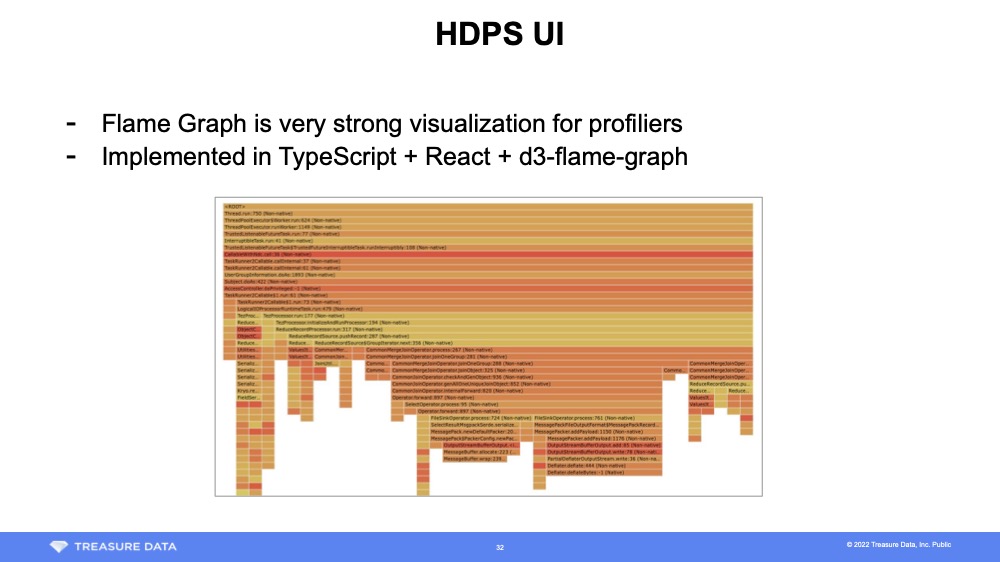
To draw a flame graph, convert the SQL output to the JSON format mentioned above and pass it to d3-flame-graph. This process is well-documneted in the d3-flame-graph documentation, and you can refer to it for additional details.
The Hive Distributed Profiling System was developed with the so-called 20% rule in mind. Treasure Data has implemented it so that deployment and maintenance are as easy as possible. However, there is room for further improvements in the future.
The technique presented here relies on the scalability of Plazma and Hive to store the stack trace in distributed storage in the most primitive format. It combines simplicity of implementation with speed of delivery.
In some cases, it may be difficult to save the all the stack traces due to the capacity and performance of the analysis queries. In these situations storing the stack trace and its "occurrence count pair" is enough to at least generate the flame graph. You can summarize as much as possible at the origin, or store it in distributed storage and then process it. Primarily the information that will be degraded by this is information about the acquisition time of the stack trace.
Like LINE's Kafka research case, if there is a use case that requires understanding what happened when the middleware was behaving strangely, it might be a good idea to save all the traces for the time being.
You can use the following profilers:
- Java Flight Recorder — This is my preference because it can be used without installation and because the API is easy to use.
- Async Profiler — This tool is used in various places and I am interested in exploring it's potential use.
- Async Profiler's Wall-clock — This profiling tool looks useful for the kind of applications introduced in this article. Since it has a Java API and can output JFR compatible files, there might be advantages to using this.
I have explained how to implement the Hive Distributed Profiling System in a little more detail than when it was announced. Ultimately, implementation requires you to link with each data platform, so it is not something that can be introduced with zero development costs. However, I hope I have made it clear that a standard data platform, a distributed storage with streaming inserts and a scalable query engine, can be implemented without any special effort.
HDPS is a profiling tool for Hive. However, I believe that the idea of storing sampled stack traces in a big data infrastructure and the implementation techniques introduced in this article are universally useful, especially for identifying middleware problems.
