This solution is meant to help machine learning engineers, marketers, and business analysts analyze time-series data such as web traffic activity, sales data, foot traffic activity, email activity etc. and discover patterns such as trend and seasonality that can be used to forecast future activity and plan marketing campaigns or seasonal promotions better. The data pre-processing steps of the workflow use only Presto or Hive functions and DigDag to ensure maximum compute efficiency and scalability on Big Data volume, which is typical for behavioral tables with one-to-many relationships. The outputs of the solution enable some of the helpful insights and use cases as follows:
- View original activity data as a Time Plot and track fluctuations in the Key Performance Indicators (KPIs) that you want to analyze over time
- Discover collinearity, trends, seasonality, and infection points in the data
- Discover patterns in the data by hourly, weekly, quarterly and yearly intervals
- Discover Top-K Outliers in the data and plot by date and year to see where major increases or decreases in business activity occurred
- Run an ensemble of ML-Models for Time Series (such as ARIMA, Sarima, Exponential Smoothening, fbProphet linear and non-linear models) to forecast business activity into the future
- Store historic tables and build a dashboard to visualize model training and optimization steps, model performance KPIs and predictions, and to keep track of metrics that improve model performance over time and ensure that the model can be used with a high degree of confidence
- TD Account must have Treasure Insights enabled
- TD User installing the package must have Edit Data Models and Dashboards TI permissions in TD
- TD User installing the package must have Workflow Edit and Run permissions in TD and must have access to the databases where the tables with the KPI metrics live.
- It is recommended that you monitor data model size monthly in the V5 console under the Insights Models tab and ensure it does not exceed 4GB over time. In the rare event that this happens with the Out-of-Box (OTB) configuration, contact your TD representative.
Ensure that you have at least one production-ready table in your TD account with a minimum of 30-days historic activity such as:
- Any behavioral table with timestamp,
user_idand recorded activity that you are trying to forecast for, such asweb-visits,order-history,inventory-history,form-submitsetc.
Perform the following steps for configuring the package installation in the Marketplace UI. Note that each step in the UI also comes with notes and examples that can guide you through the process as you run the installation.
Enter parameters such as Master API Key, API Endpoint, Working Database, Project Name, which will be used to install and run the package in your TD account and save the output tables in the provided database name. 
Define the database and table name of the input table that contains the activity you want to forecast for, using the machine learning model. Also, you can specify a custom Time Filter if you only want to train the model on a subset of the data starting at a specific date. 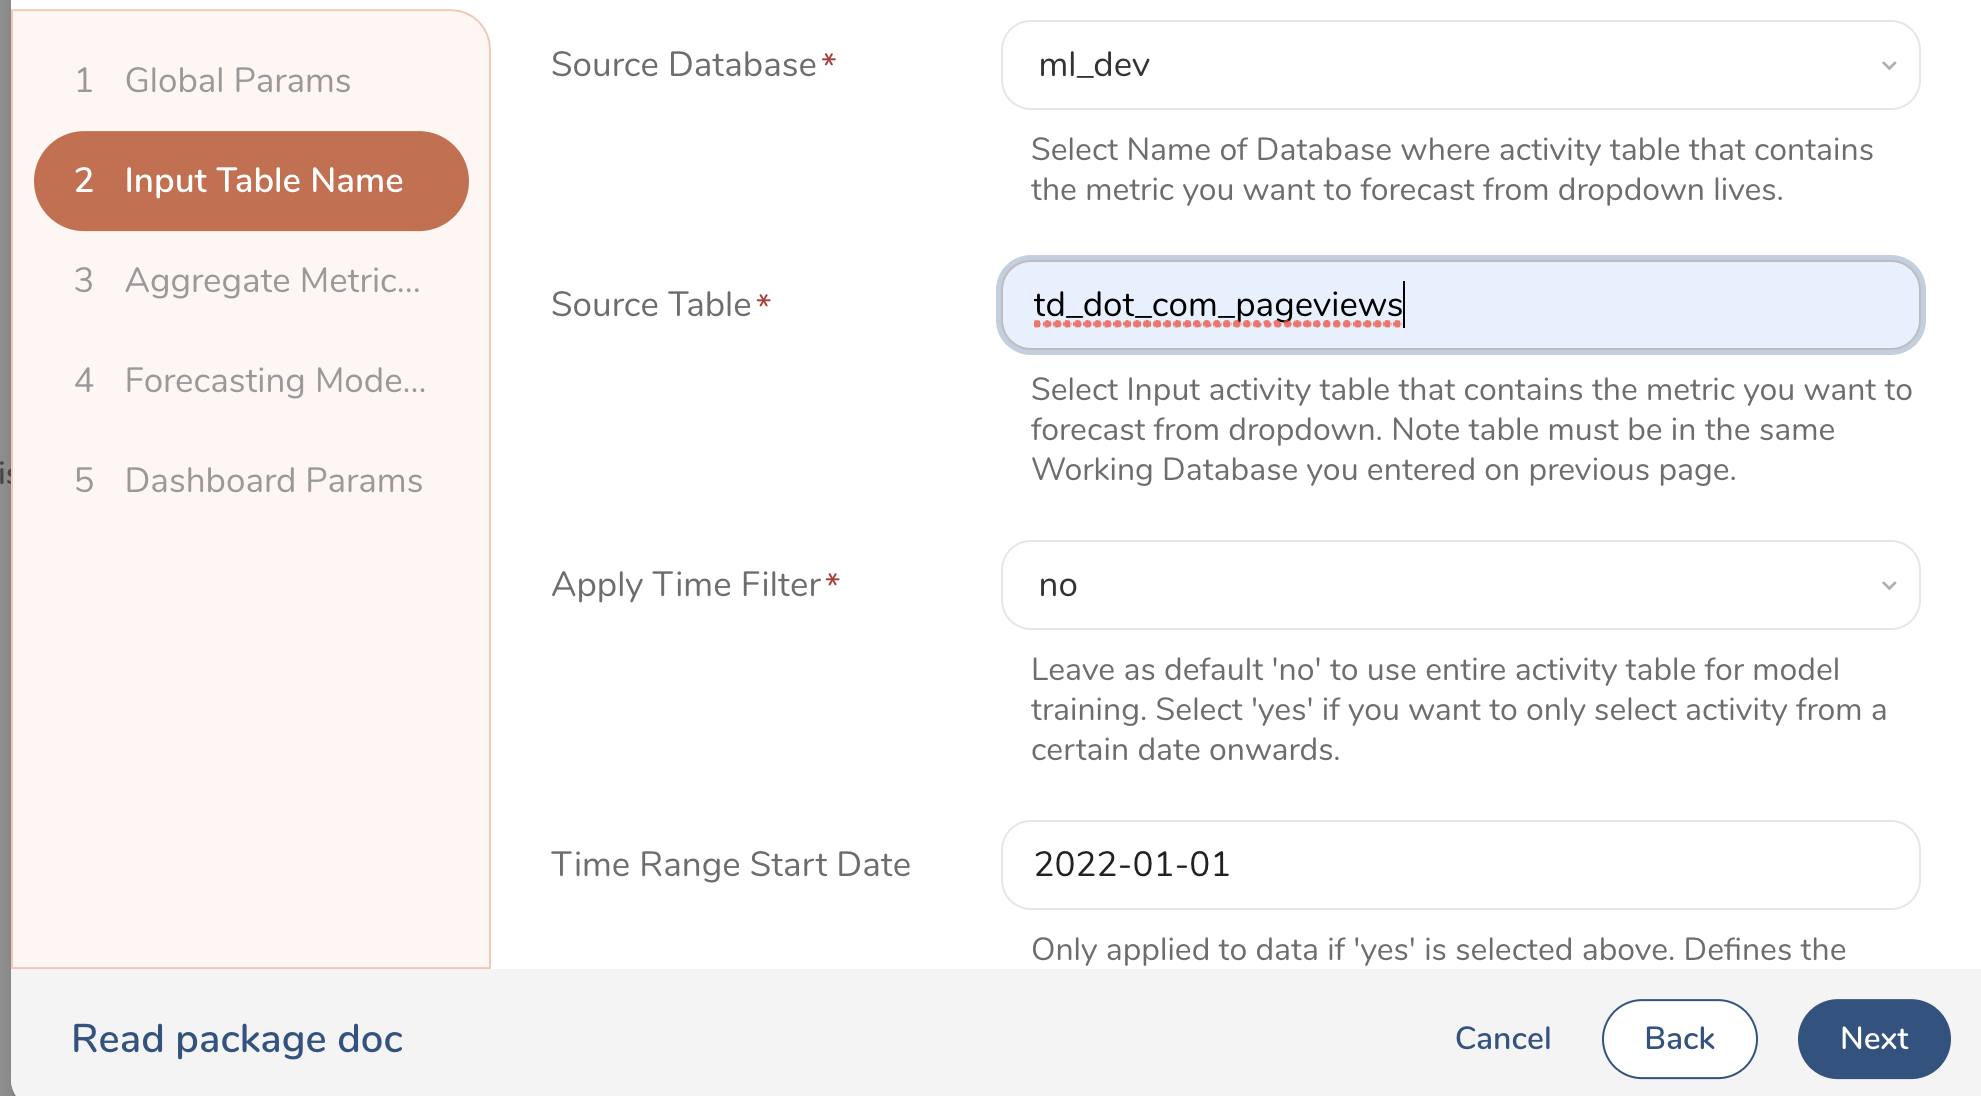
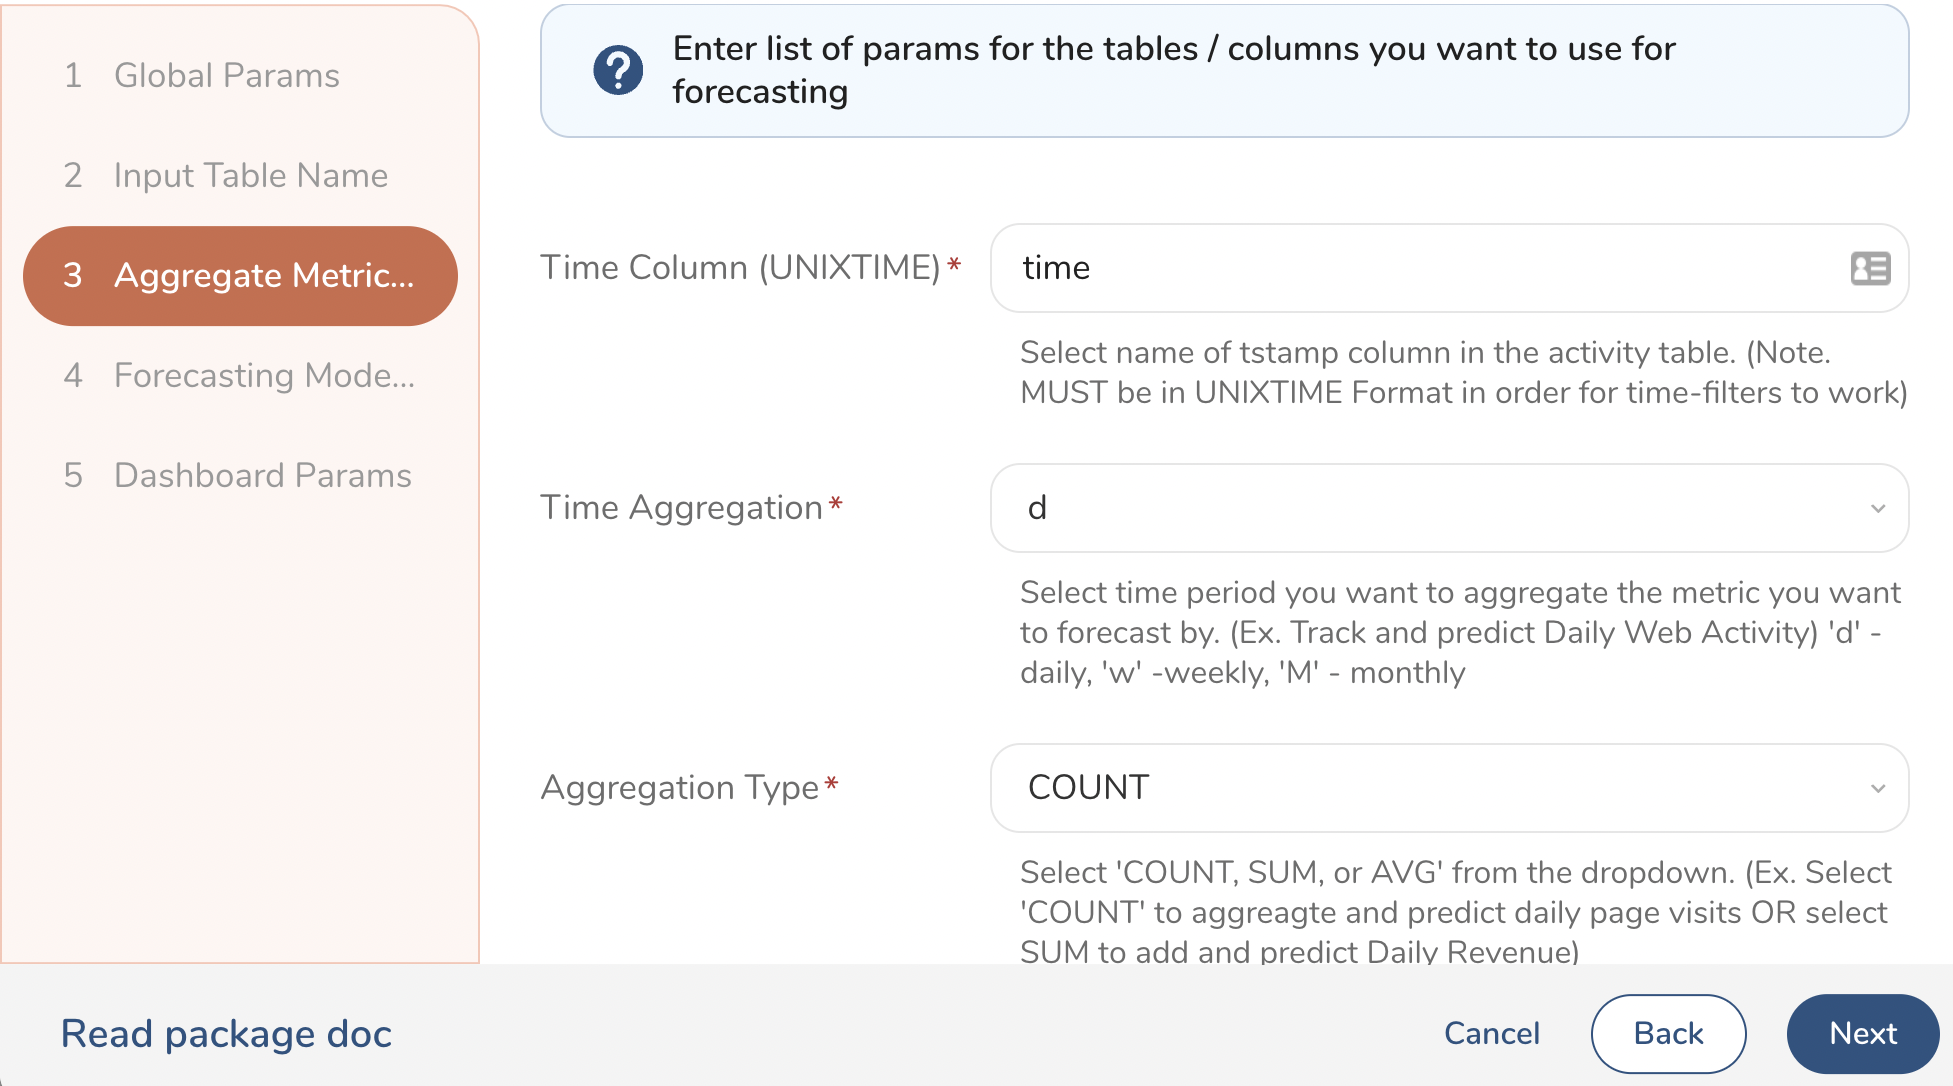
Provide the UNIXTIME column name, the time-period aggregation you want to forecast by (day, week, month etc.) and aggregation types of the activity you want to forecast (For example, sum(), count(), avg()). You also need to specify the name of the activity column you want to forecast for (For example, sales or leave as 1 if you are just doing a total_count). You can also provide a custom WHERE clause SQL type filter to activity table, if necessary.

1 of 2
It is advisable to leave the trend and seasonality as default during the first installation. This runs the Time Series Forecasting model with the most commonly used parameters for trend and seasonality. The most important parameter to change in this section is the Forecast Steps, which determines how far into the future the model predicts the metric that you want to analyze.

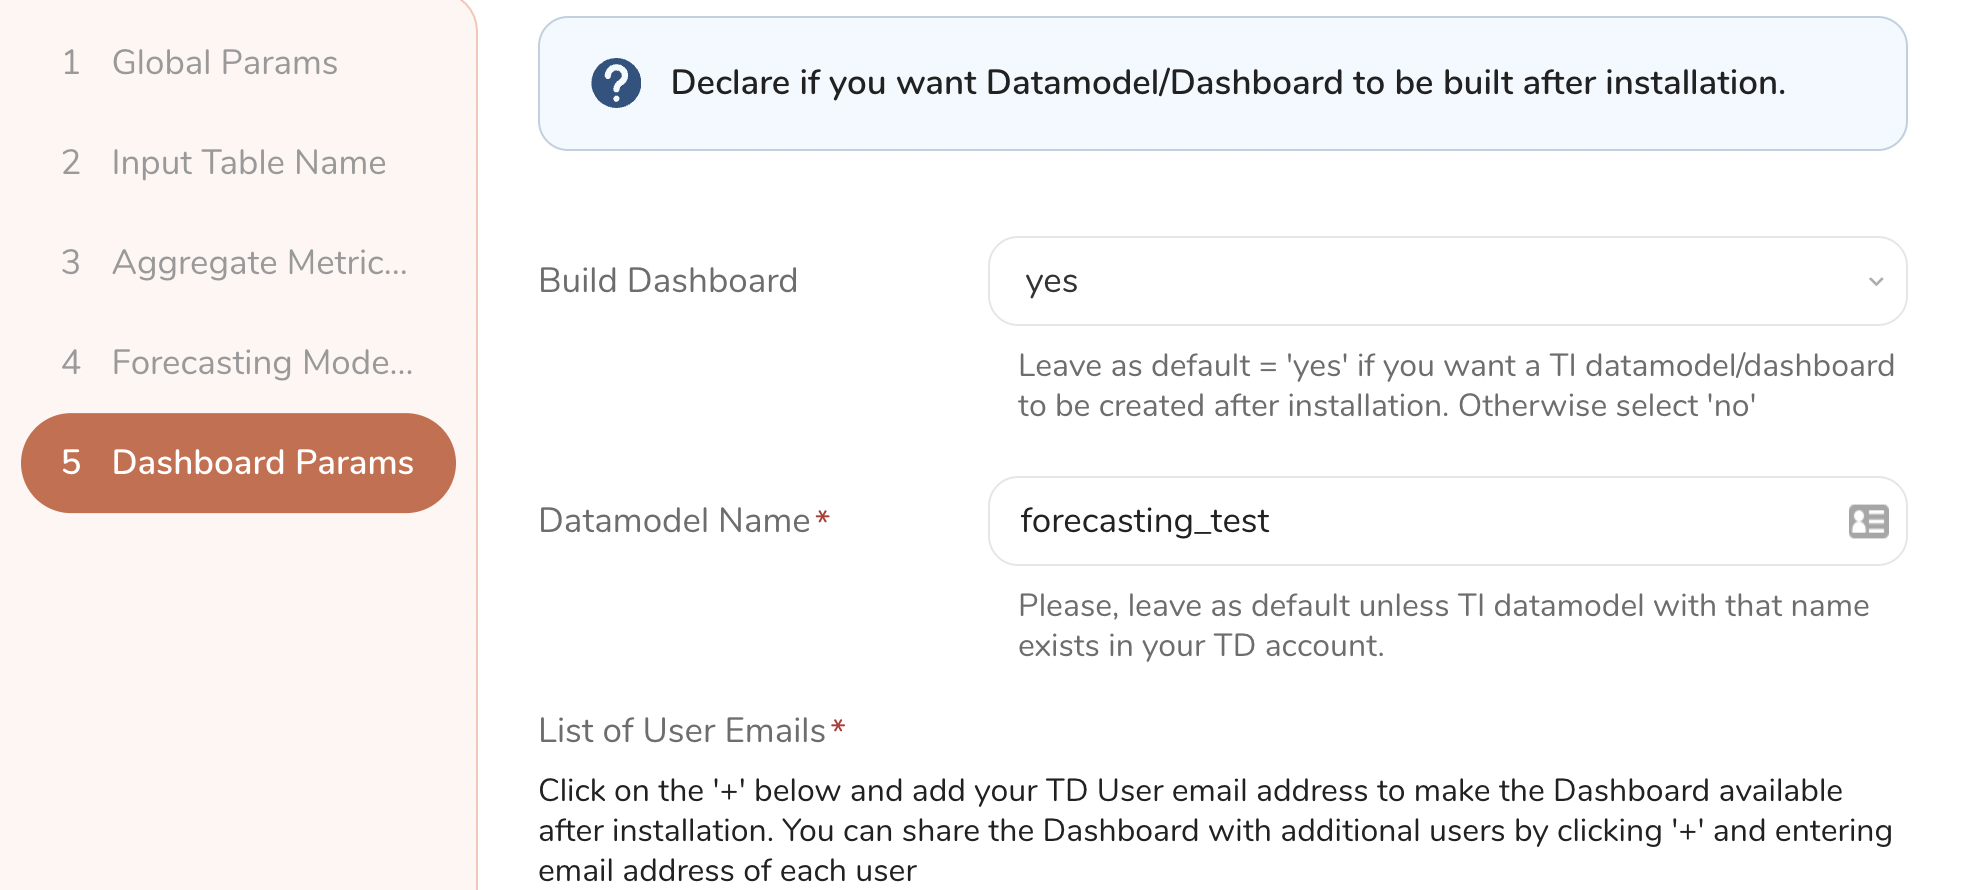
You MUST provide at least the email of the person installing the package or mark it as N/A, if dashboard build is not required. In addition to the email of the user installing the package, you can also provide a list of emails of TD users who should have access to the dashboard after the package is installed.
All emails on the list, should have at least View Dashboard permissions in Treasure Insights, otherwise dashboard build might fail.

1 of 2
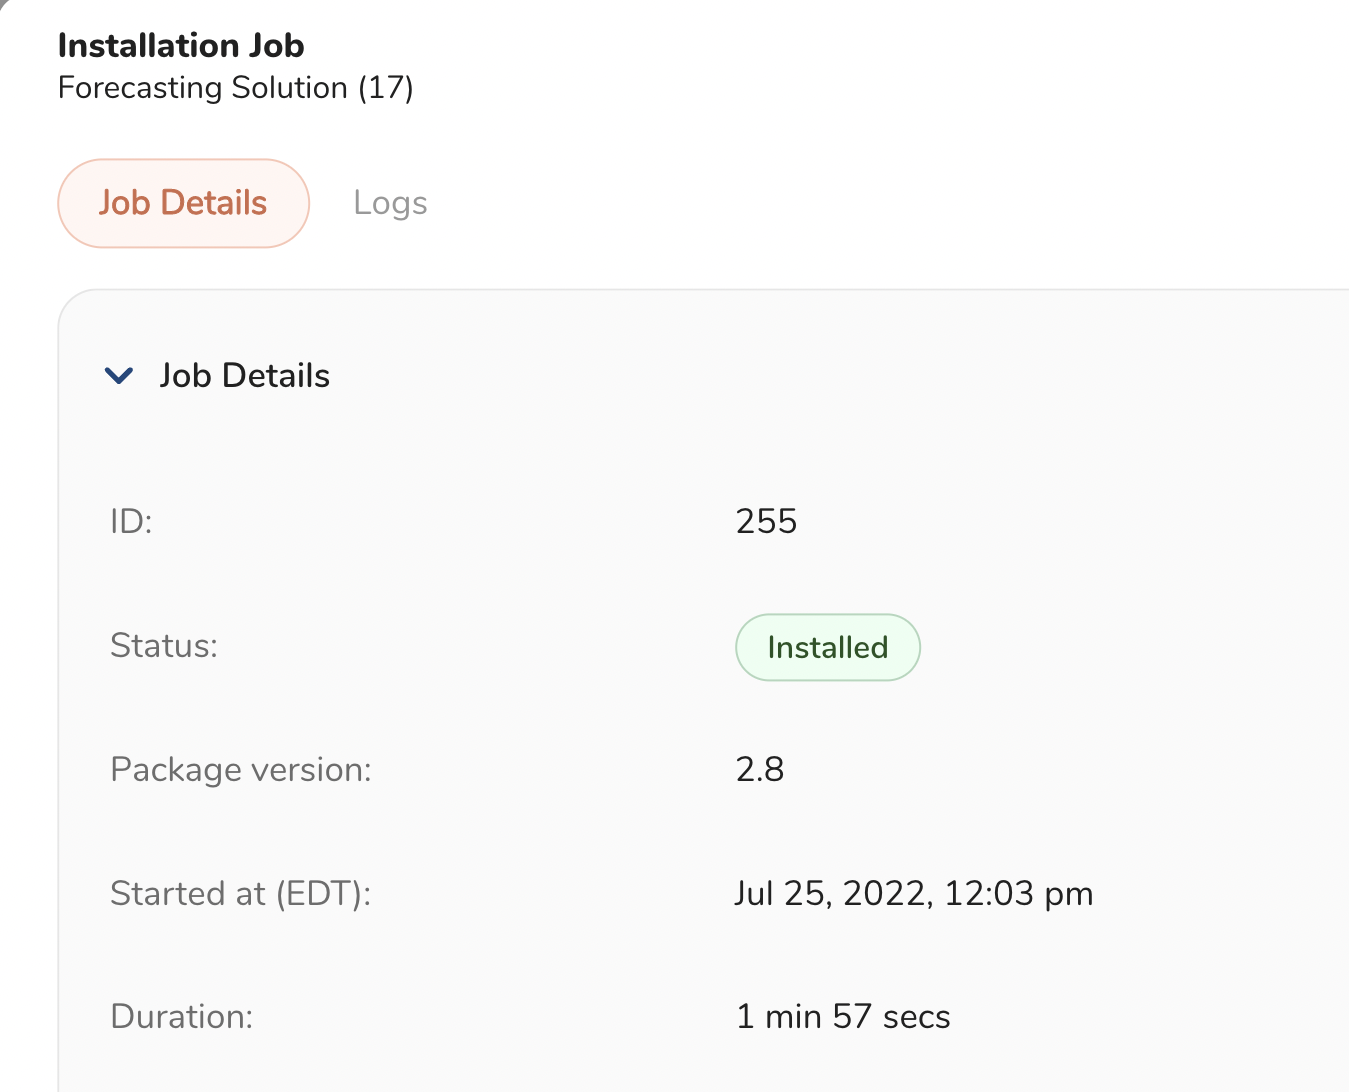
After you fill out the parameters in the UI for the first 5 steps, you will be presented with an Install button. Click that and you will be linked to a screen where you can monitor the installation logs. If you get a success message, it means that all parameters were accepted and the package was installed successfully in your TD account. If you get an error message, check the Error Logs for more details. If you cannot determine the reason of the failure, contact your TD representative for technical support.
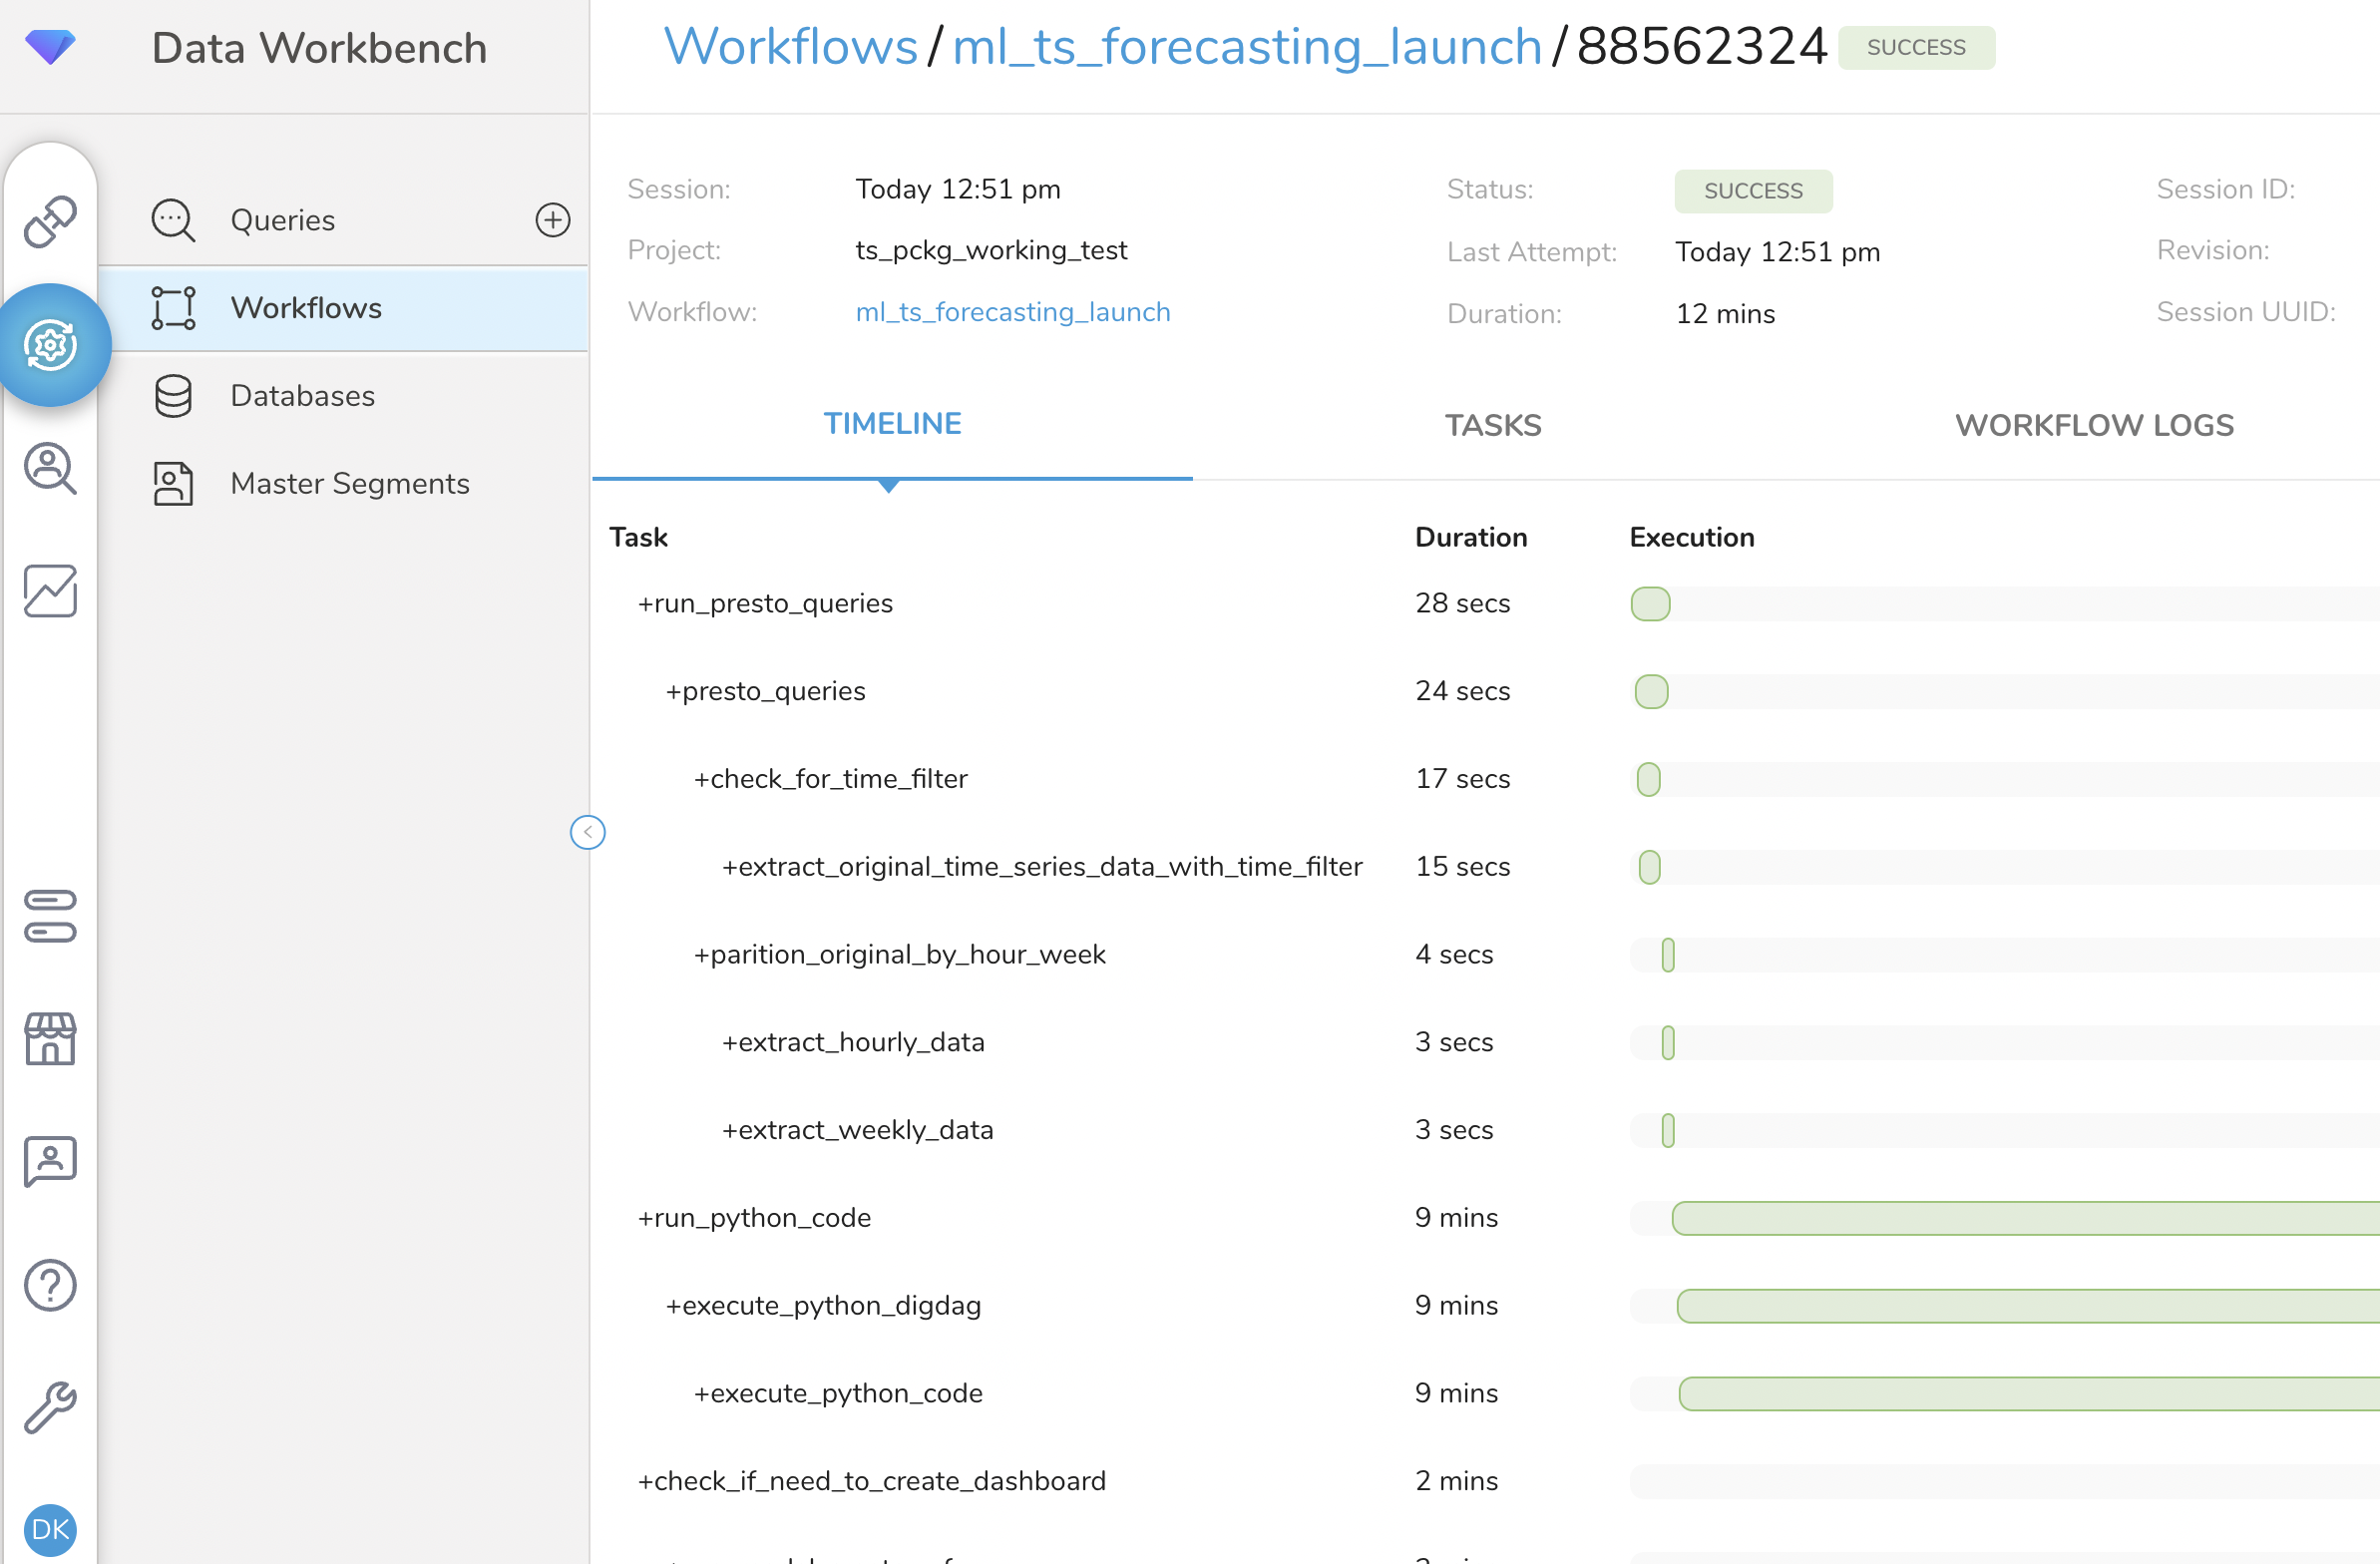
A successful package installation will trigger a Workflow Run in TD, which might take anywhere between 10 to 20 minutes depending on the data volumes and your compute units. You must wait for the Workflow Run to complete before you can explore the output tables and the Time Series Forecasting dashboard. If you want to monitor the workflow runs, navigate to Data Workbench -> Workflows in the TD Console and search for the ml_ts_forecasting_launch workflow. If the workflow is still running, you should see a blue dot under the Run History. If the run was successful, you will see a green dot as shown in the screenshot below. If the workflow throws an error, you will see a red dot and you can go explore the Error Logs and contact TD support for help.
The workflow is set up, so that the end user only needs to configure the .yml files in the config\ folder and the config.json file in the main project folder and the workflow can be ran to execute end-to-end code automatically. In fact, these files are automatically configured for you during the Package installation. The parameters you are entering in the UI will be dynamically populated in the proper lines inside the yml and json config files. However, you can modify these parameters after installation manually when further customization of the solution is needed to fit additional data context and use cases that might not be covered by the OTB configuration. The details on how to configure each yml or config file are as follows:
After installation, manual customizations are ONLY recommended for technical users with some experience with DigDag and SQL/Python. If you do not have such resources available, contact TD support and we can help customize some of the code to your needs, as possible.
The workflow is set up so that the end-user only needs to configure the config/global.yml file in the main project folder. The details on what each parameter does, are as follows:
############# INPUT DATABASE AND TABLES #########################
sink_database: ml_dev
source_database: ml_dev
source_table: td_dot_com_pageviews- sink_database: The name of the database where the model output tables will be stored.
- source_database: The name of the database where the activity table which you want to forecast for, is stored.
- source_table: The name of the original activity table with one-to-many relationships where each row is an event with a timestamp and contextual metrics related to the event (For example, pageviews with URL or order events with sales amount).
######## DATA PRE-PROCESSING AND AGGREGATION PARAMS ################
unixtime_column: time
tstamp_aggregation: 'd!'       #-- for day use d! and for weekly use w!
activity_aggregation_syntax: COUNT(*)
aggregate_col_name: page_viewsunixtime_column: The name of timestamp column in the original behavior table. This MUST be in UNIXTIME format.
tstamp_aggregation: This parameter controls how we will be aggregating the timestamp column depending on whether we want to analyze and forecast - daily, weekly, or monthly. Use w! for weekly, m! for monthly, y! for yearly.
activity_aggregation_syntax: Enter the syntax for the activity aggregation you want to analyze and forecast for. (For example, for web activity you can use COUNT, but for total revenue, you might use SUM)
aggregate_col_name: Enter the name of the aggregate column you will be forecasting (For example,
page_views,total_sales,email_opensetc.).
################ CUSTOM DATA FILTER PARAMS #####################
apply_time_filter: 'no'
start_date: 2020-01-01
filter_regex: REGEXP_LIKE(td_url, 'treasuredata.com') - allows you to apply conditional filers on the original behavior table in case you want to only analyze and forecast a certain portion of the data. In the example above, we will only be analyzing pageviews to the US Site of Treasure Data - treasuredata.com- apply_time_filter: If set to no, the entire time-history of original activity data will be aggregated and analyzed. If set to yes, then code will read the
start_dateparameter above and only select events fromstart-date-to-current.
############ ENSEMBLE MODEL PARAMS ##############
trend: 'add'
seasonality_length: 7
decomposition_method: 'multiplicative'
forecast_steps: 30trend: Set to add when Time Series analysis from the previous step, identifies a clear trend in the data. We use additive when we have a linear trend (trend goes up around 45 degrees or less) and mul (multiplicative) when the trend is exponential. In the additive model, the behavior is linear where changes over time are consistent in magnitude.
seasonality_length: Set to the number that is discovered during your Seasonality, PACF and ACF analysis. For example, if a daily time series data has weekly seasonality, we set this to 7. If it has monthly seasonality, we set this to 12.
decomposition_method: We use multiplicative models when the magnitude of the seasonal pattern in the data depends on the time/date component. On the other hand, in the additive model, the magnitude of seasonality DOES NOT change in relation to time.
forecast_steps: Enter a value for how many steps (For example, days) ahead you want to forecast.
Treasure data recommends that your training dataset has at least 3X of forecast_period. If you are trying to forecast for next 30 days, make sure that you have at least 90 days of original data for model training.
############# INSIGHTS MODEL PARAMS #############
create_dashboard: 'no'
model_config_table: datamodel_build_historycreate_dashboard: Set this to yes when you want to send the model output tables to TI Insights Model for Dashboard. When set to no the data pre-processing and ML Forecasting tasks will run, without sending final output tables to the Insights model or dashboard.
model_config_tabl: This table will contain the name and OID of all TI data models built using this workflow.
Controls important parameters used by Python Custom Scripting .py files to create the final JSON for the Datamodel and build and share it via the API.
"model_name":  "Segments_dashboard_v5" (name of datamodel)
,
"model_tables": [
                ] (list of tables to be added to datamodel)
,
"shared_user_list": [ "firstname.lastname@treasure-data.com"] (list of users to share datamodel with)
,
"change_schema_cols": {
    "date": ["run_date", "event_time"],
    "text": ["ENTER_NAME"],
    "float": ["ENTER_NAME"],
    "bigint": ["ENTER_NAME"]}
        (list of columns you want to change datatype from raw table to datamodel. Ex. in "date" you provide column names that will be converted to datetime)
,
"join_relations": {"pairs":[]
                  }
} (if any joins were required you can add a list of table_name:join_key pairs)ml_ts_forecasting_launch.dig - Main project workflow that executes end-to-end solution with
sub_workflows. After the project is built end-to-end, you can just automate and schedule this main workflow, so model and dashboards can be updated at the desired frequency.ml_ts_presto_queries.dig - The
sub_workflowthat does all the original data pre-processing and aggregation needed for training Python model and dashboard views.ml_ts_python_code.dig - The
sub_workflowthat runs last and reads from the output tables of thepresto_queries.digworkflow and executes Time Series Analysis and Forecasting functions in Python.
- ts_forecast_original_data - The original behavior table, aggregated by desired
time_periodandSUM/COUNTof activity column, which will be used as the main source for the rest of the Time Series analysis and dashboard views.
| event_date | event_hour | agg_metric |
|---|---|---|
| 2020-12-30 | 6 | 103 |
ts_forecast_hourly_data - Hourly stats and aggregations of original data for dashboard view.
ts_forecast_weekly_data - Weekly and Quarterly stats and aggregations of original data for dashboard view.
ts_forecast_get_seasonality_data - Contains list of seasonality values, if seasonality is detected in original data.
| seasonality_presence | seasonalities |
|---|---|
| true | 7 |
- ts_forecast_outlier_change_point_data - Contains outliers and change point periods when big spikes in the data occurred.
| event_date | agg_metric | is_outliers | is_changepoint | outlier_type |
|---|---|---|---|---|
| 2020-12-30 | 1906 | 1.0 | 1.0 | low |
ts_forecast_seasonal_trend_component - Table with metrics such as trend, seasonality, residuals which are used to decompose original data and prepare it for Forecast Model training.
ts_forecast_train_forecast_data - Train dataset used for training Time Series model.
| event_date | agg_metric | agg_metric_type |
|---|---|---|
| 2020-12-30 | 103 | Training |
- ts_forecast_val_pred_data - Validation dataset used for testing model predictions and calculating performance KPIs.
| event_date | agg_metric | prediced_value |
|---|---|---|
| 2020-12-30 | 103 | 107 |
ts_forecast_model_summary - Contains a summary of model hyper-parameters, time of training, and performance KPIs such as rmse, mape, z_score, and std used to evaluate errors and pick the best model.
ts_forecast_forecast_data - Contains final forecast for the chosen
forecast_stepsparameters inconfig/global.yml, including upper and lower confidence Intervals for the predictions.
| event_date | training_start_date | fcst_start_date | forecast_period | trend | seasonality | decomposition | target_mean | mape | rmse | rmse_zscore | rmse_std_ratio |
|---|---|---|---|---|---|---|---|---|---|---|---|
| 2020-12-30 | 2020-06-01 | 2022-06-02 | 30 | add | 7 | multi | 492.23 | 65.4 | 123.1 | - 1.7412 | 0.6531 |
The Time Series Forecasting dashboard reads from an Insights Model build from the params listed in the config.json file. All tables in the data-model can be joined on event_date if there is a need to apply Global Date filters. By default, this includes the tables listed above. More tables and metrics can be added upon customer request to fulfill additional use case requirements.
- Time Series Analysis - Provides a variety of widgets that can help a data scientist, marketer, or business analyst perform a deep-dive Time Series Analysis of the original behavior data and spot important statistical patterns such as trend, seasonality, auto-correlation, hourly and weekly patterns, outlier events etc.
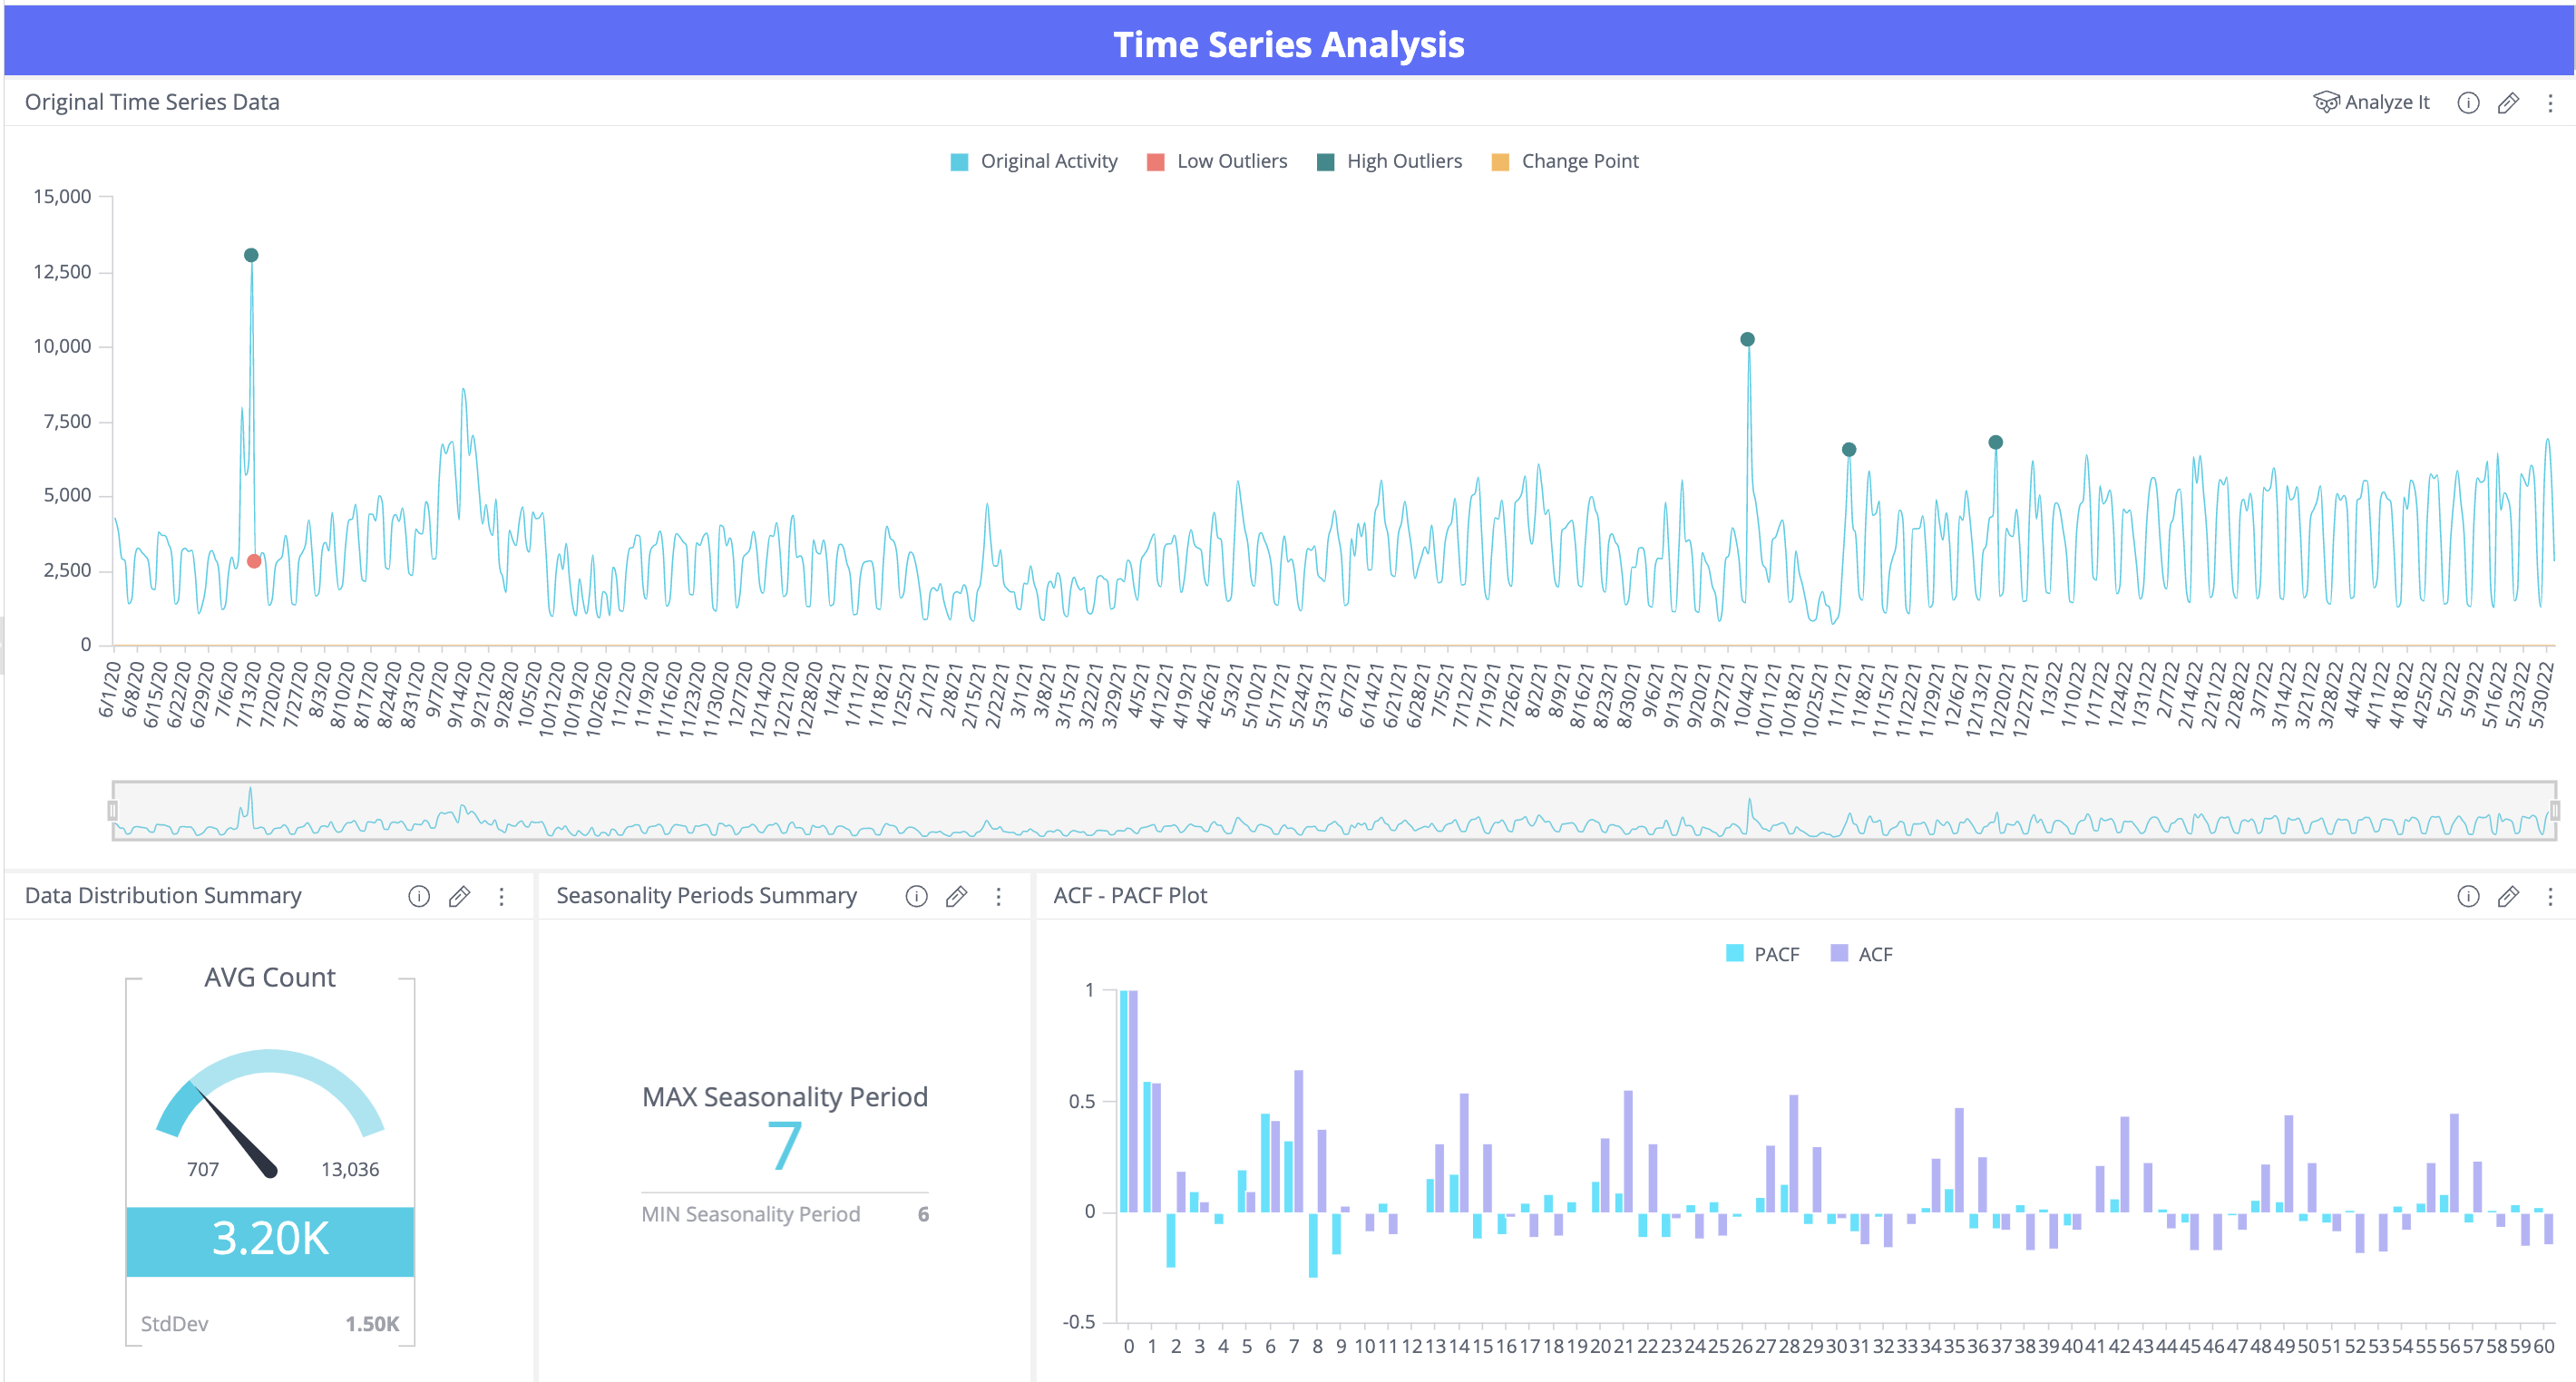
Original Data Timeline with Outliers and Major Change Points

Seasonality and Trend

Outlier Detection and Hourly/Weekly Patterns
1 of 3
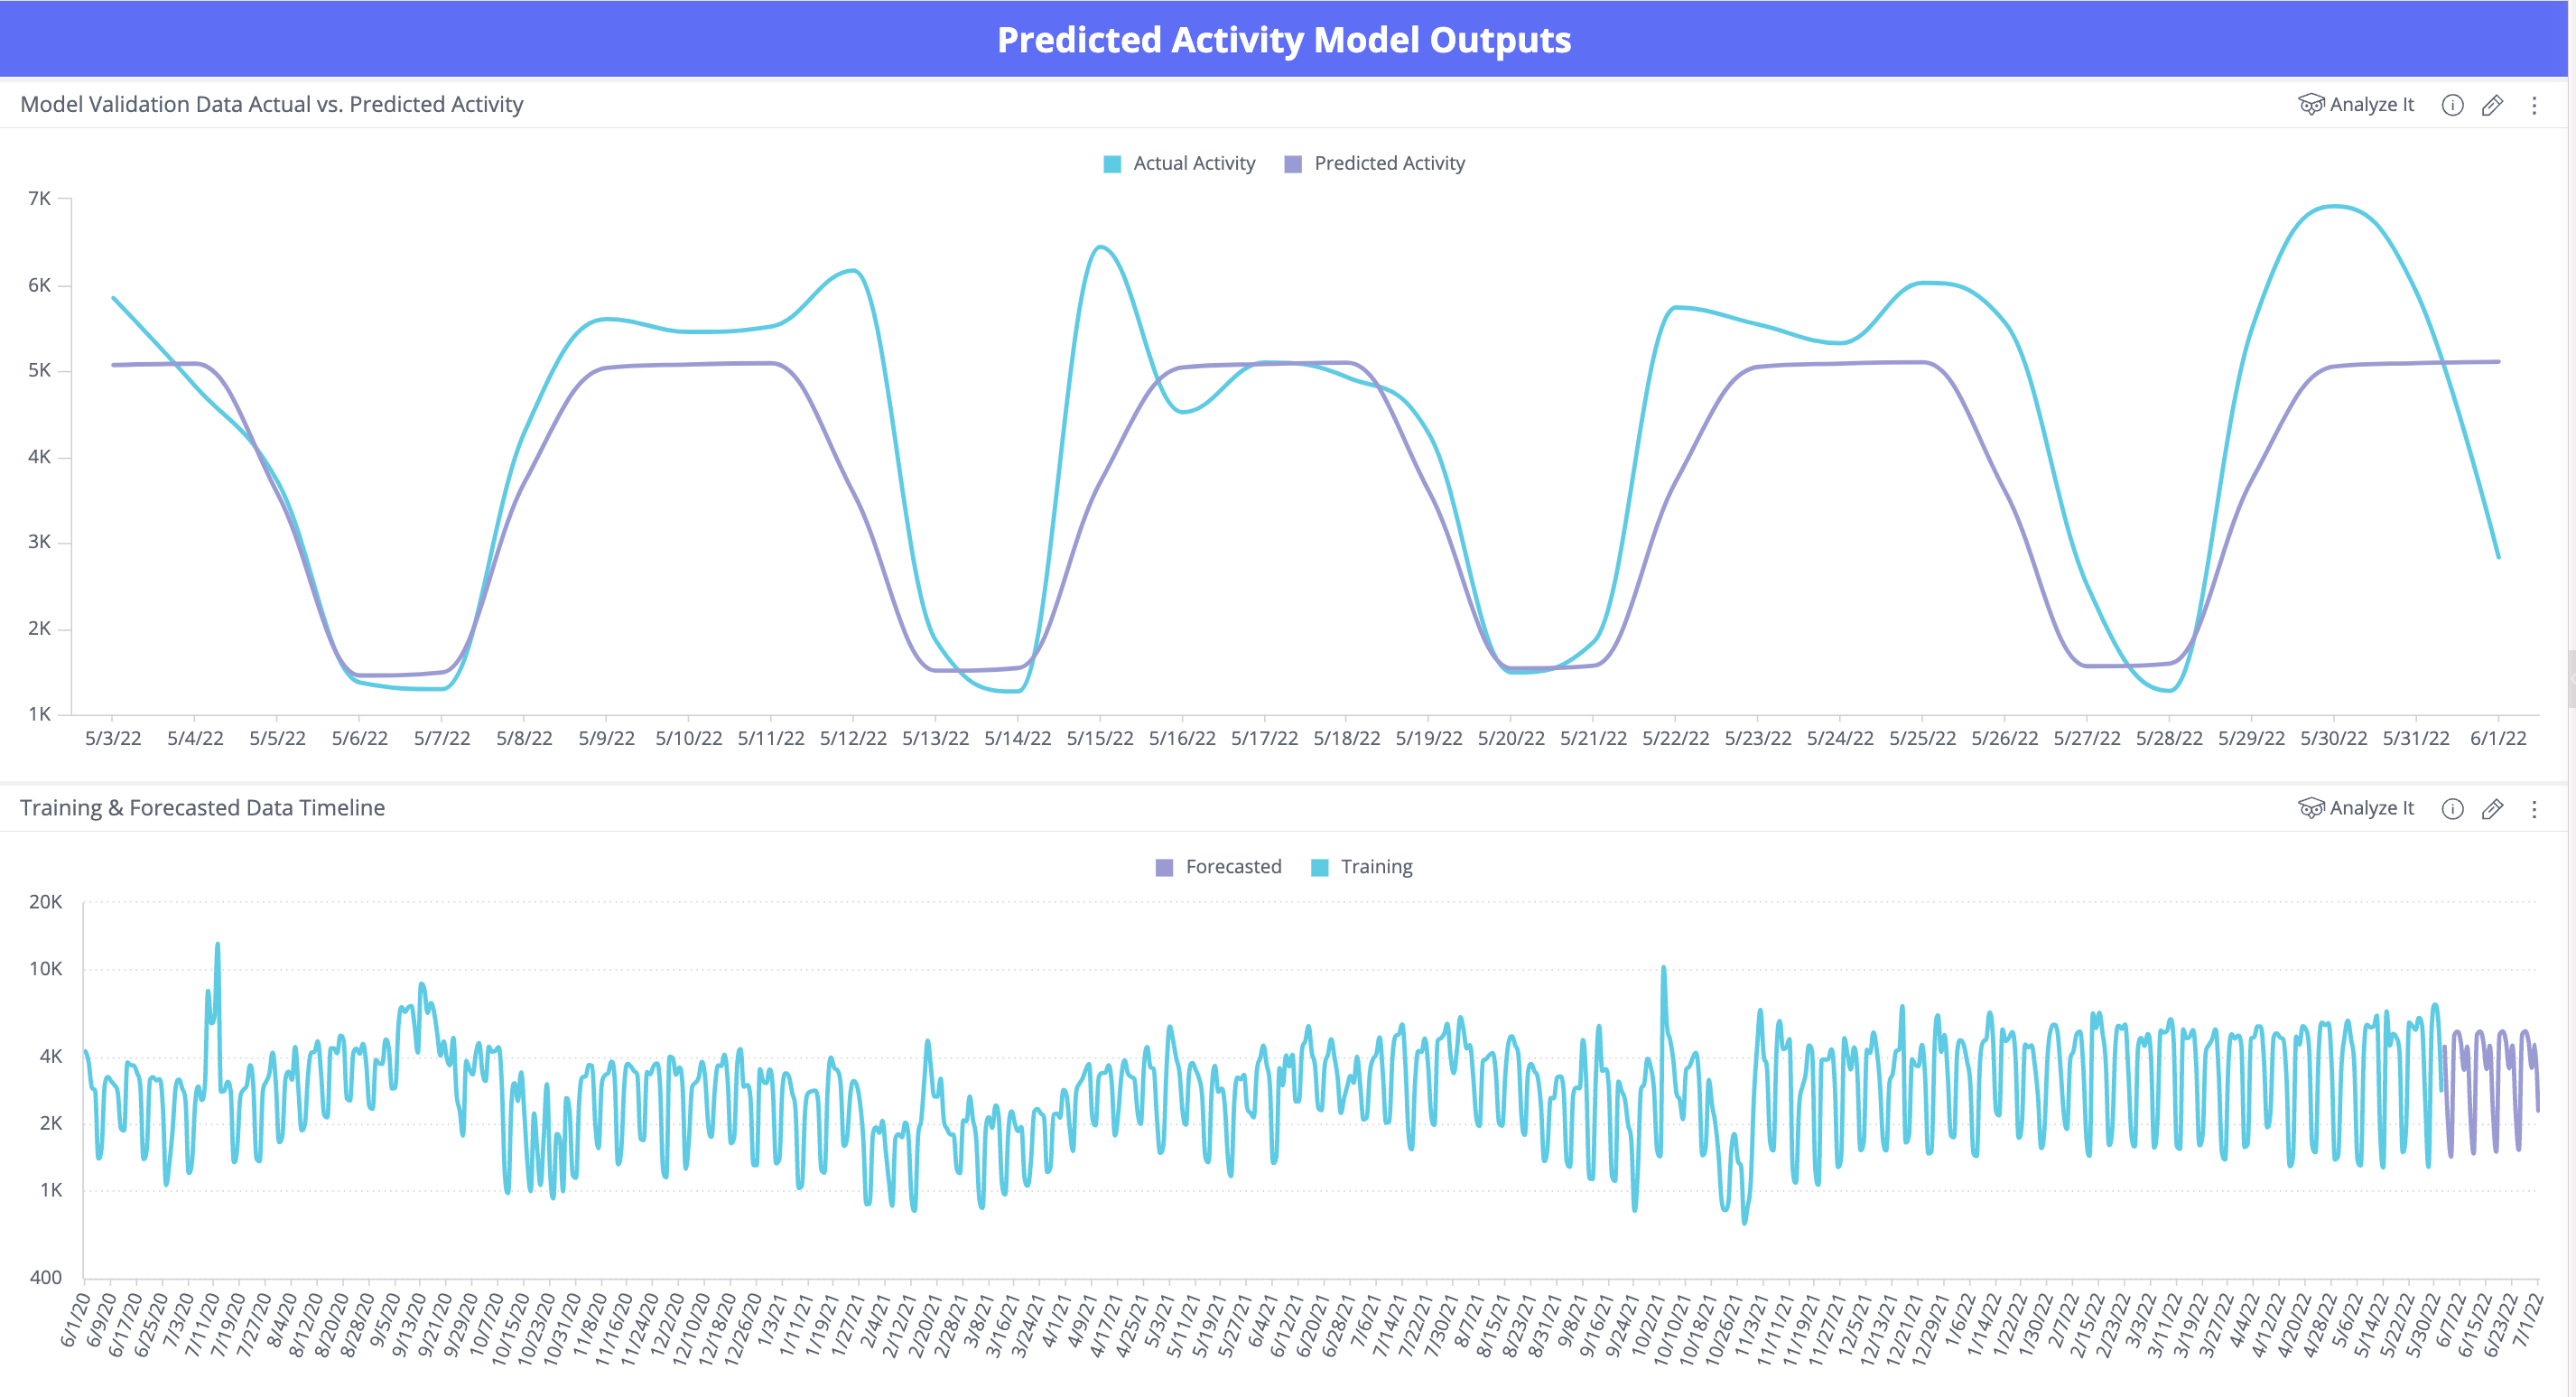
- Predicted Activity Model Outputs - Provides Model Forecast plots, including training data, validation data, actual vs. predicted, and confidence interval plots.
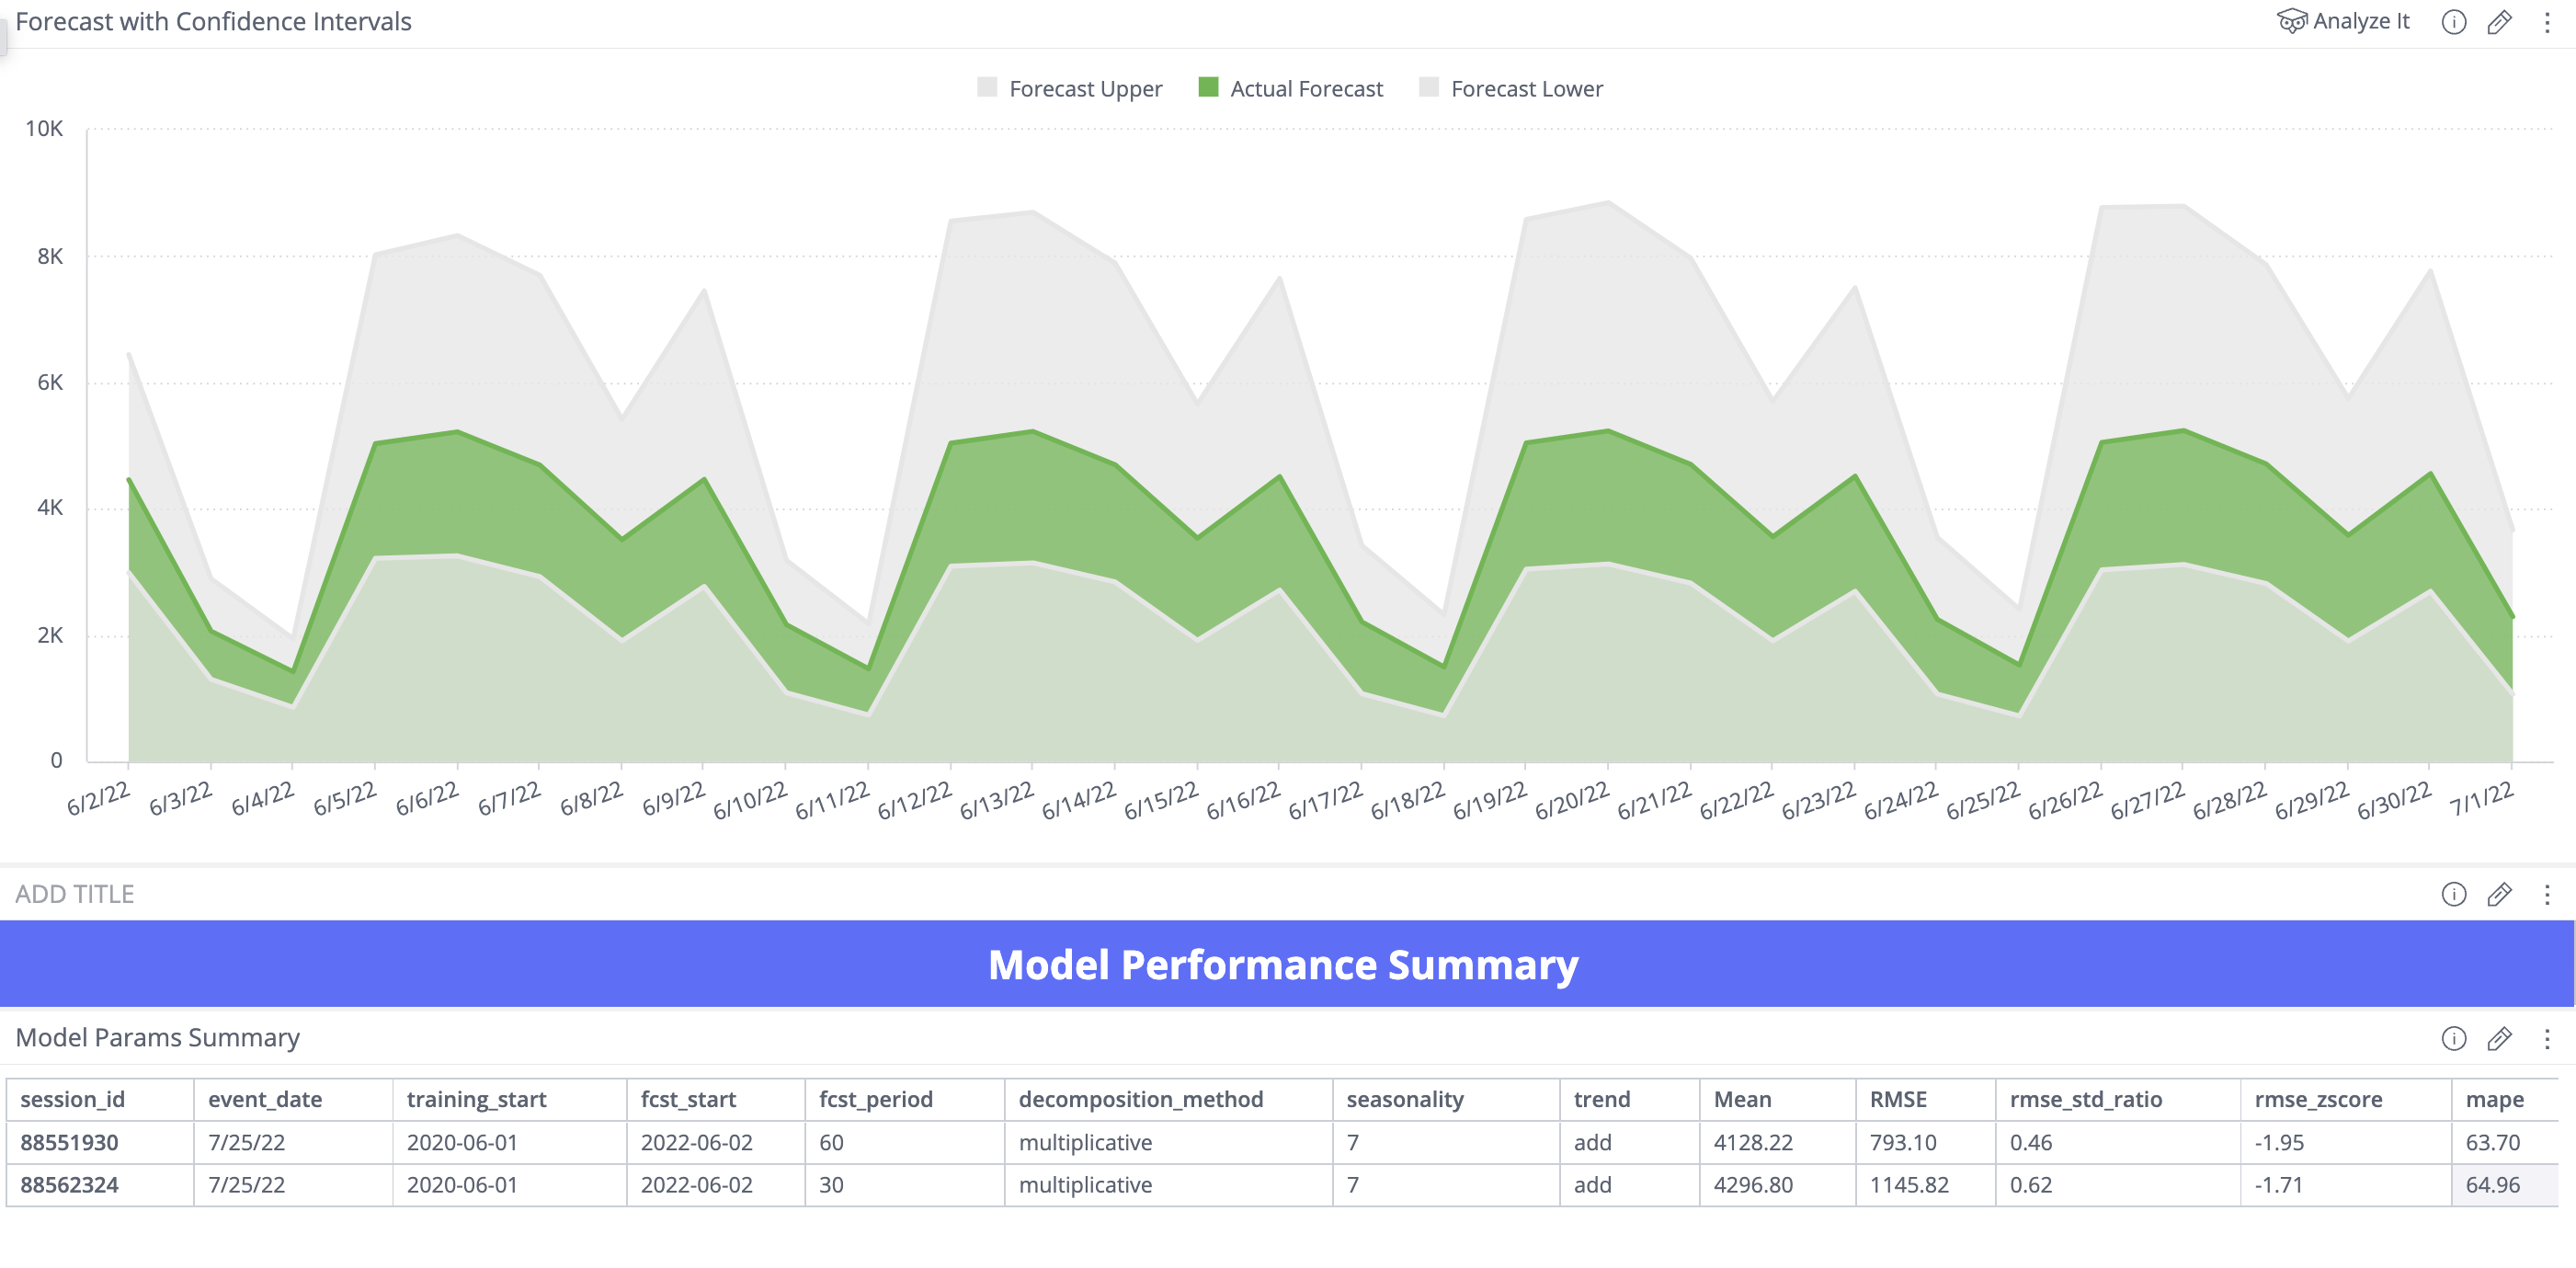
- Model Performance Summary - Shows the predicted values with an estimated upper and lower confidence intervals. Provides a Model Summary table, which includes model hyper-parameters, time of training, and performance KPIs such as rmse, mape, z_score, and std used to evaluate errors and pick the best model.
- Global Filters - The dashboard can be filtered by
event_datecolumn, and global filter can be applied yearly, quarterly, monthly, weekly, or daily.
extract_time_series_data.sql - This reads the
input_tableparams from theglobal.ymlconfig file and selects the data from the original input activity table, aggregated by the selectedtime_period, and filtered by custom WHERE filter if user selected those inputs in the UI during workflow setup.SELECT TD_TIME_STRING(CAST(CAST(${unixtime_column} AS DOUBLE) AS BIGINT), '${tstamp_aggregation}') as event_date, hour(from_unixtime(CAST(CAST(${unixtime_column} AS DOUBLE) AS BIGINT))) as event_hour, ${activity_aggregation_syntax}(CAST(${aggregate_col_name} AS DOUBLE)) as agg_metric from ${source_database}.${source_table} ${filter_regex}extract_time_series_data_time_filter.sql - Does the same as the above query, but adds a time filter using the
${start_date}param, iftime_filterwas set to yes by user during the workflow setup in the Marketplace UI.SELECT * FROM ${source_database}.${source_table} WHERE TD_TIME_RANGE(CAST(CAST(${unixtime_column} AS DOUBLE) AS BIGINT), '${start_date}')hourly_views_across_all_years.sql - Aggregates the original activity table yearly, so (yearly, quarterly, weekly) metrics can also be analyzed.
python_files/main.py - This executes all the necessary Python functions that read the output aggregated table generated by the SQL Queries in the previous step and perform Time Series analysis and model training and forecasting using the Kats library and an ensemble of Time Series Forecasting ML models.
After you get the success message after a package is installed, you can locate the installed workflow in the Console UI and navigate to the Data Workbench > Workflows tabs on the left. The name of the project should be the same as the name that you gave it in the Project Name tab during package installation. Use this documentation as a guide on how you can modify the global.yml file to customize future outputs to additional metrics you might want to analyze and forecast using this solution as well as test out different seasonality, trend and forecast period parameters.
Find the installed workflow project using the guide from the paragraph above and identify the ml_ts_forecasting_launch.dig file, which is the main project file that runs the entire end-to-end solution. Select Launch Project Editor on the top right in the console and then select Edit File on the bottom right. At the very top of the file, you might see a section as follows:
###################### SCHEDULE PARAMS ##################################
##schedule:
##  daily>: 07:00:00
If you uncomment the two lines above, the above example will automatically run the workflow every day at 7:00 am UTC time. For more scheduling options, refer to the DigDag documentation.
No. Output tables, workflow or dashboards created by the package will NOT be deleted if the package is uninstalled.
Please contact your TD representative, and they will be able to dedicate an Engineering resource that can help guide you through the installation process and help you with any troubleshooting or code customization, if needed.