The purpose of Segment Analytics solution is to allow CDP users (marketers, campaign analysts, etc.) to track important Key Performance Indicators (KPIs) for the audiences they build and activate for marketing campaigns in Treasure Data Audience Studio. The dashboard allows to filter and compare specific segments by the segment name and time period. Some of the Out-of-Box (OTB) metrics include:
High level summary of counts and population sizes for Parent Segment, Audience Studio folders, and Audience Studio segments in the given Treasure Data (TD) account.
Filter segments by parent segment name, folder name and track KPIs such as:
Segment population growth over time (daily, weekly, etc.)
Total and AVG order value
Total, Unique and AVG number of items purchased
Total, Unique and AVG number of page views
Total, Unique and AVG number of email events (clicks, opens, sends etc.)
Track business rules changes for each segment
To add custom metrics after installation, contact TD supoort.
- Track campaign KPIs across Audiences build in Treasure Data.
- Gain valuable business insights and optimize marketing campaigns.
- Easily track daily performance of A/B Testing Segments.
- Catch unauthorized segment rule changes that might affect population size and performance negatively and revert back to previous logic.
- Measure and communicate the business value of CDP across your organization.
- TD Account must have Treasure Insights enabled.
- TD User installing the package must have Edit Data Models & Dashboards Treasure Insights (TI) permissions in TD.
- TD User installing the package must have Workflow Edit & Run permissions in TD and must have access to the databases where the tables with the KPI metrics live.
- It is recommended that you monitor data model size monthly in the V5 console under the Insights Models tab and ensure it does not exceed 4GB over time. This should not happen with the OTB configuration, so contact TD support in the rare event that this occurs.
Perform the following steps for configuring the package installation in the Marketplace UI. Note that each step in the UI also comes with notes and examples that can guide you through the installation process.
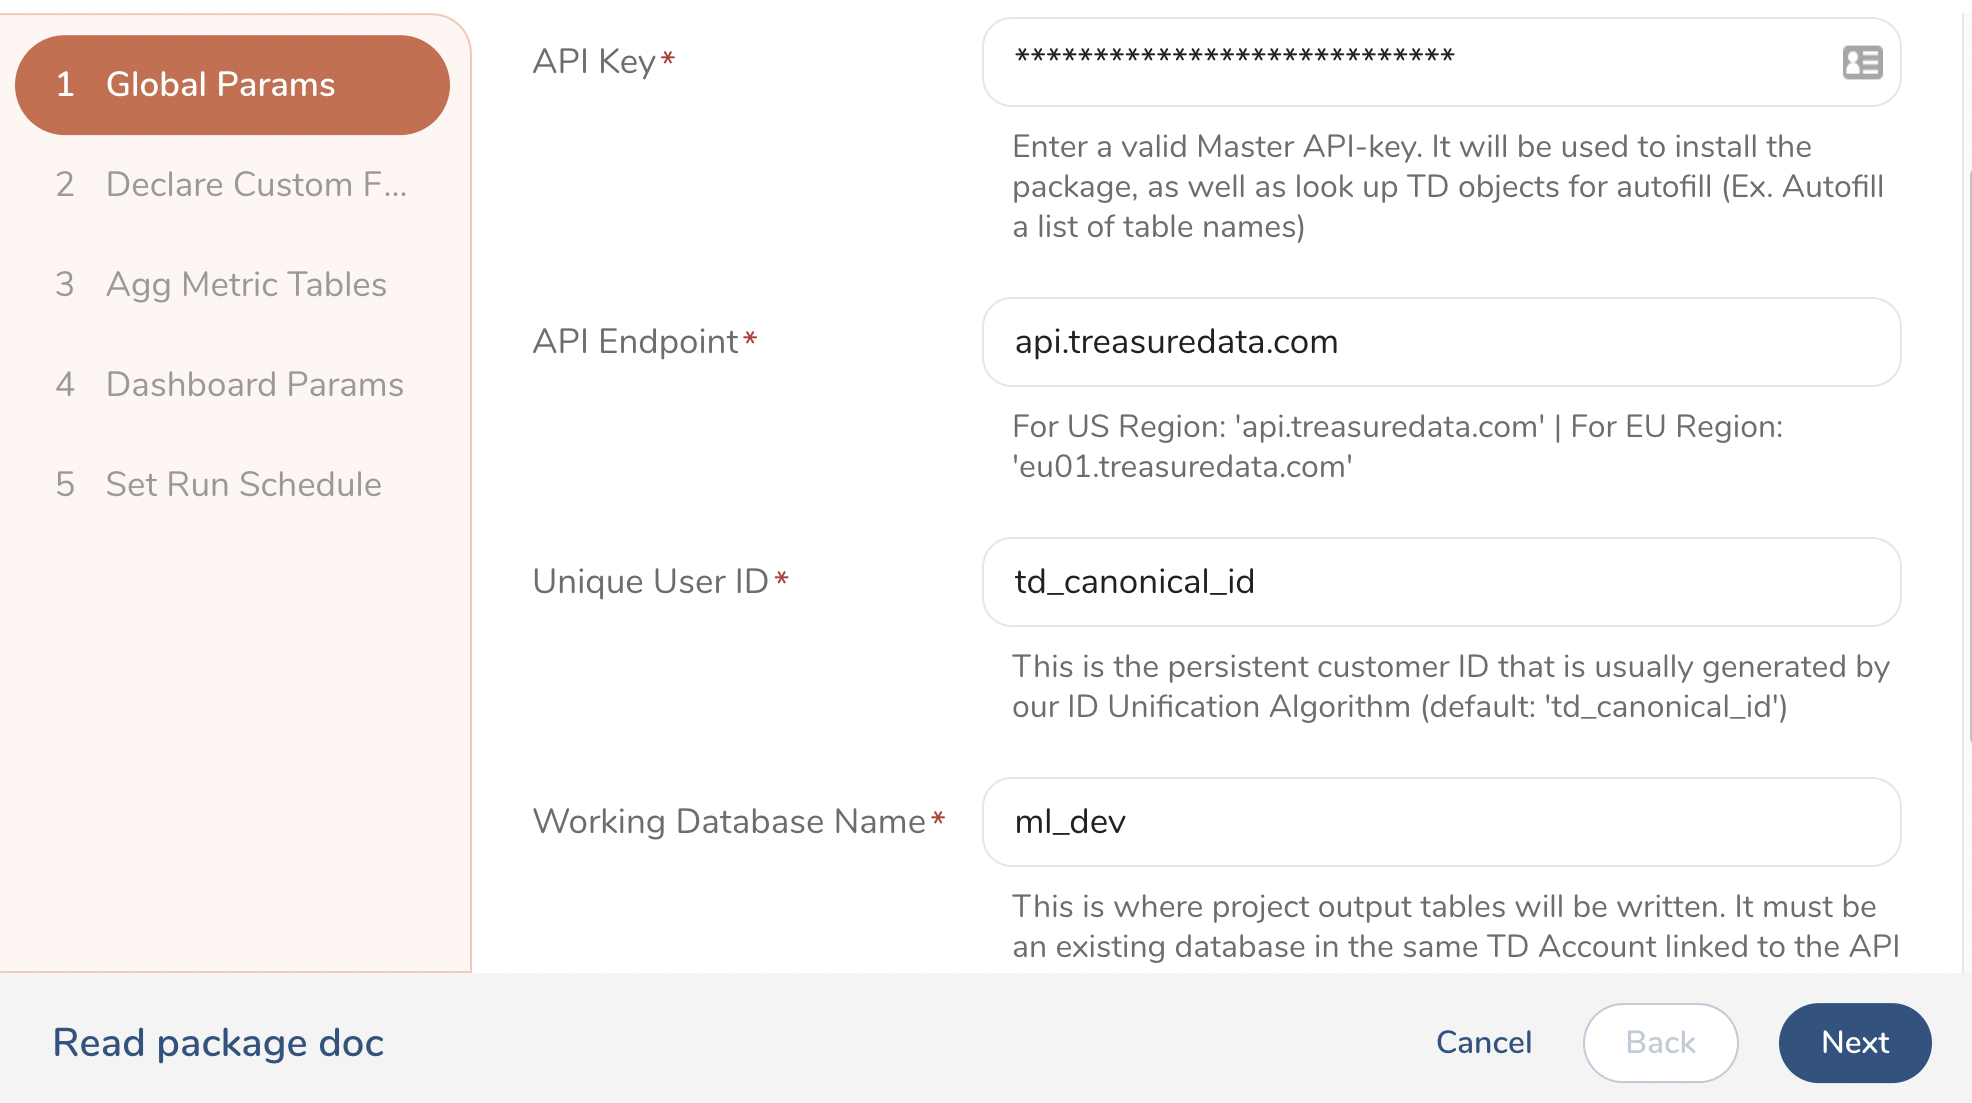
Enter parameters such as Master API Key, API Endpoint, Working Database, Project Name, which will be used to install and run the package in your TD account and save the output tables in the provided database name.
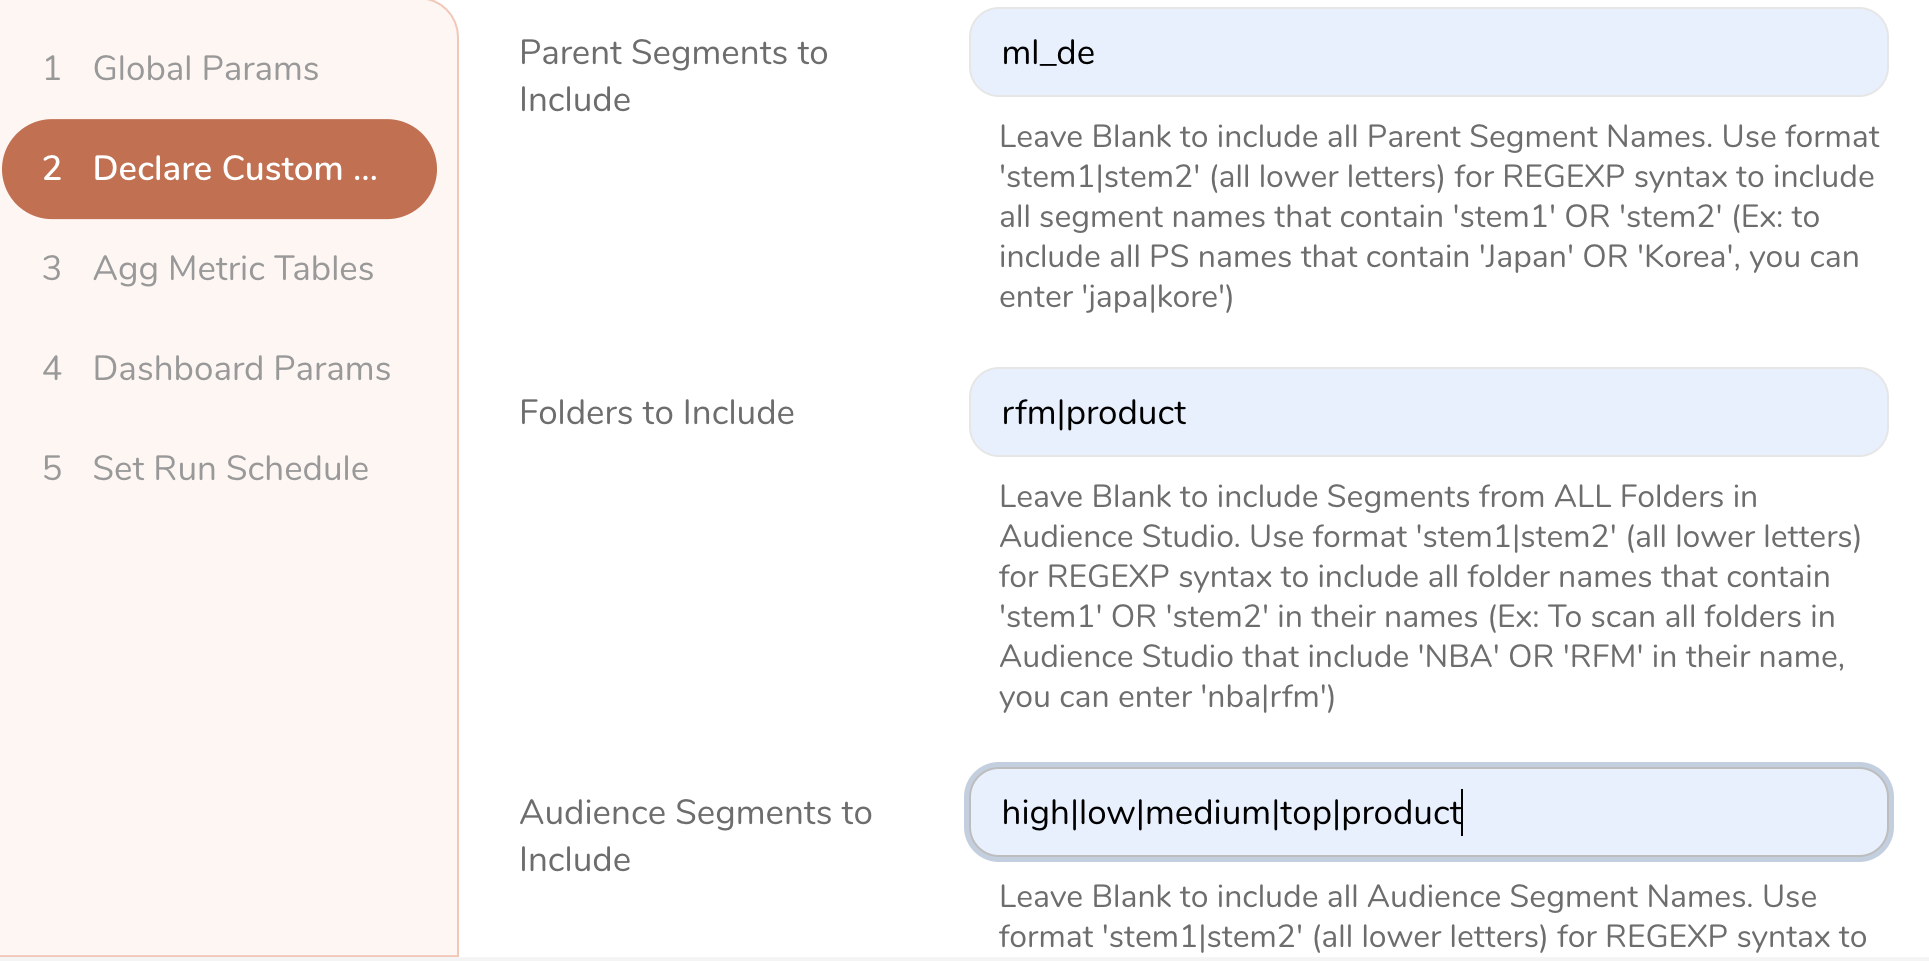
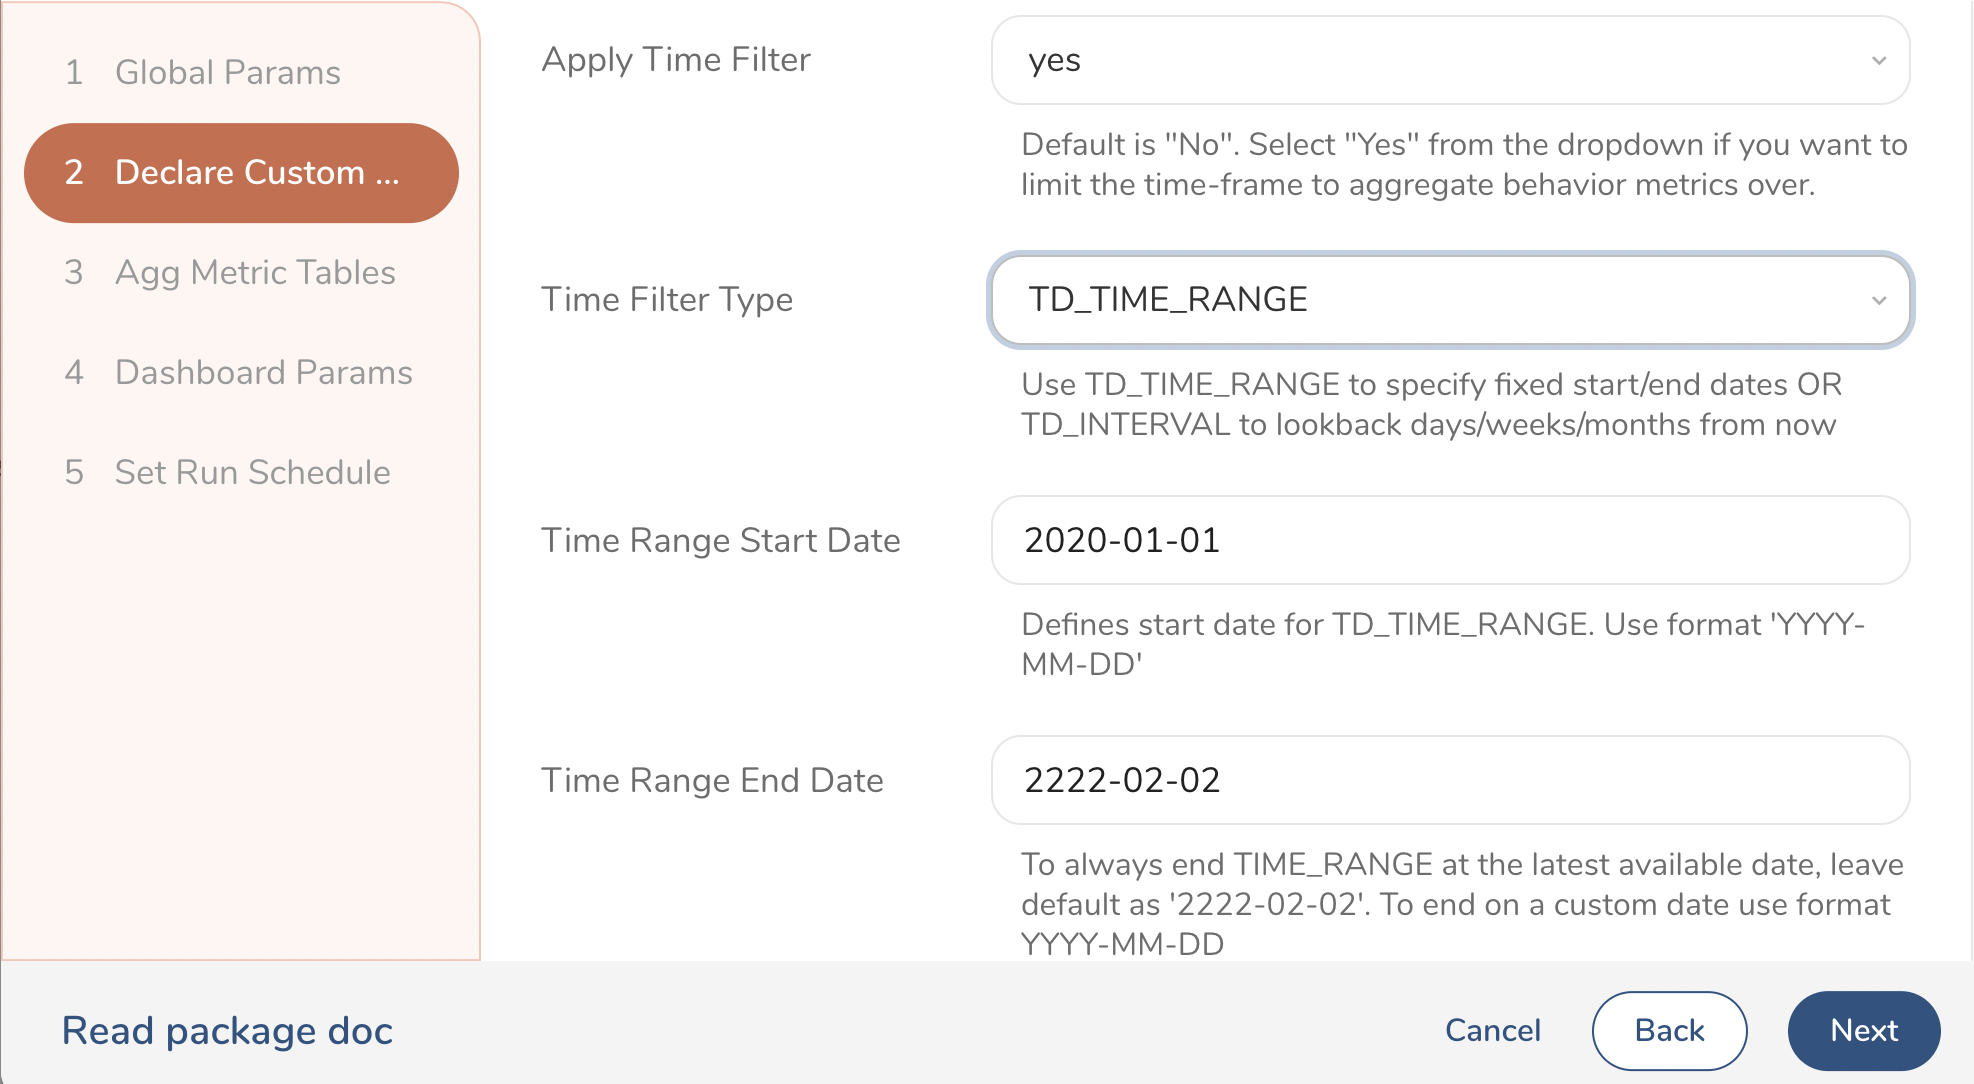
Define if you want to use custom filters to only select Audiences from specific folders names or segment names in Audience Studio that you want to analyze and compare. This also allows you to define a specific time range for the KPI metrics you will be tracking in case you want to limit that to only the period when a certain campaign is active etc.


1 of 2
1 of 2
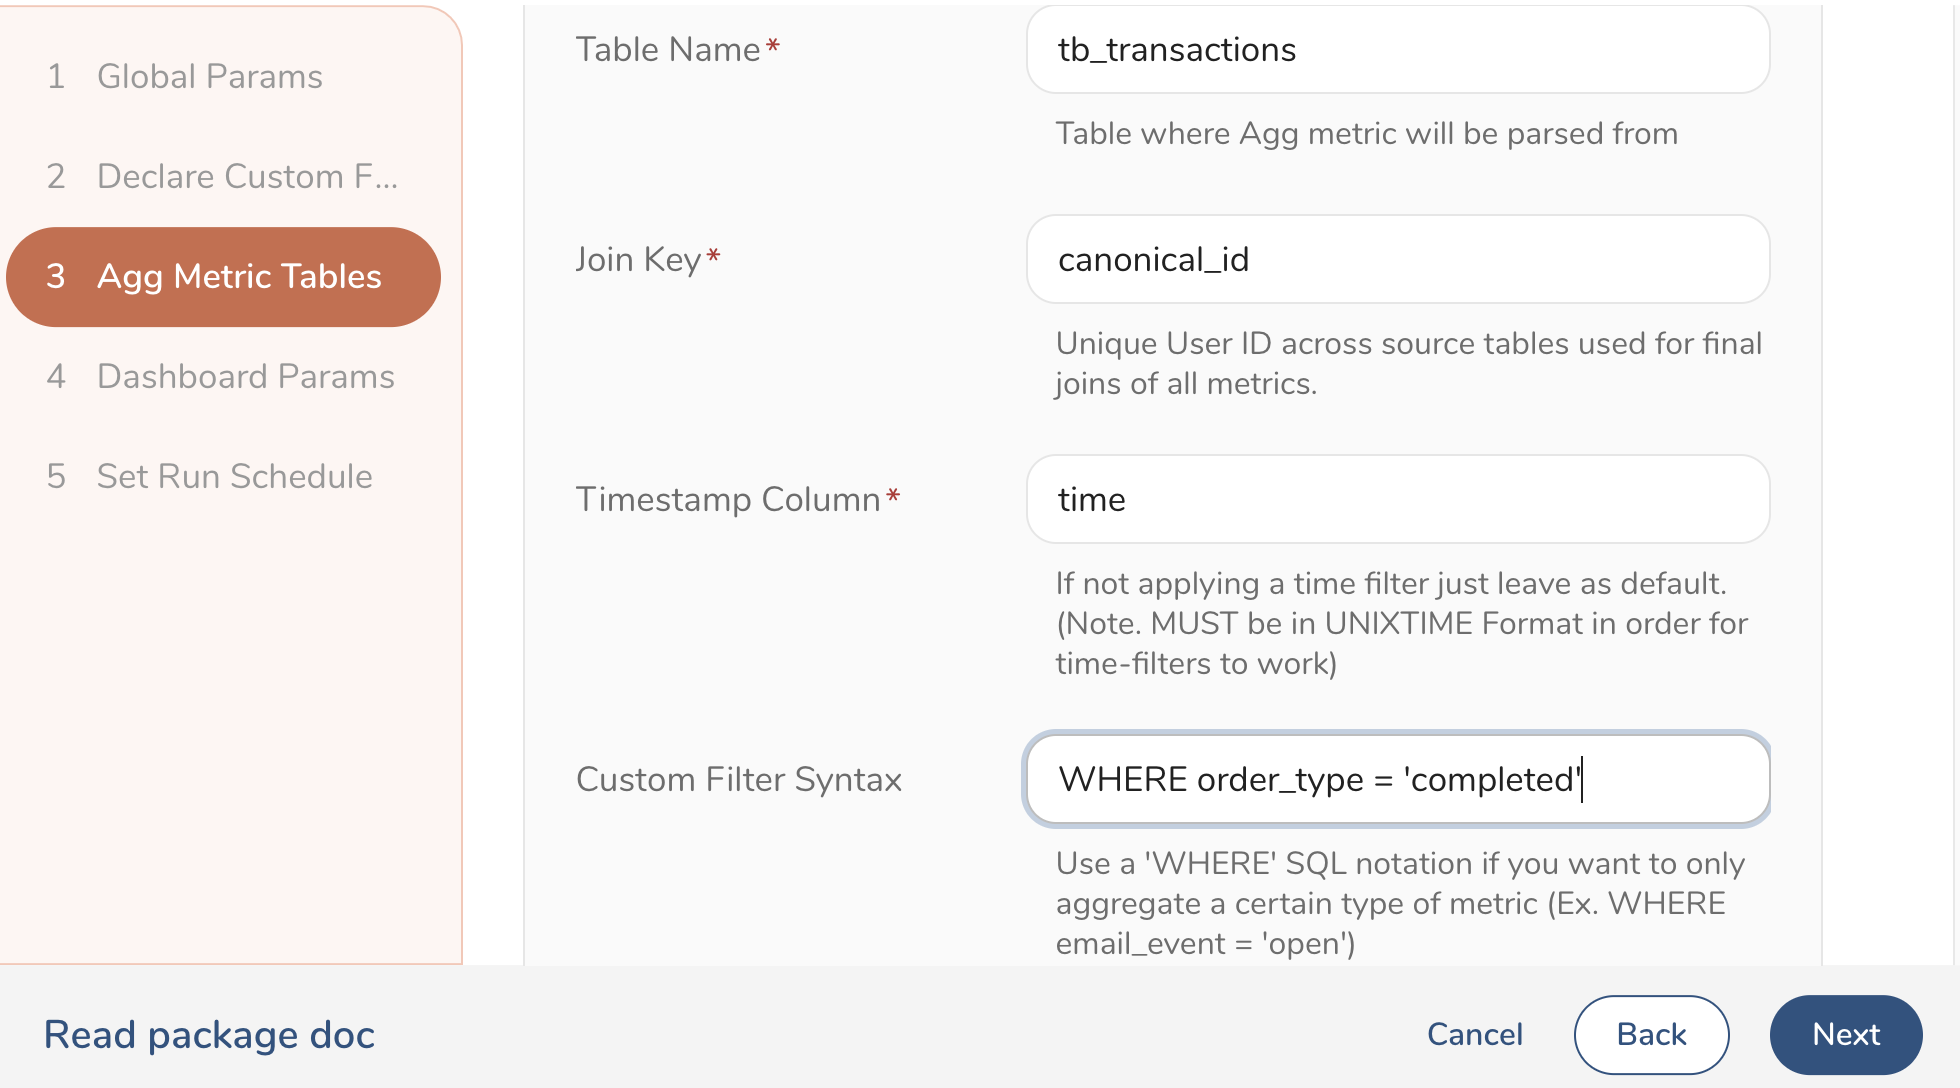
Provide a list of table names, column names, and aggregation types ( sum(), count(), avg(), etc. ) to dynamically generate a list of KPIs ( email_opens, order_counts, total_revenue etc.) that you will track across the selected audiences.
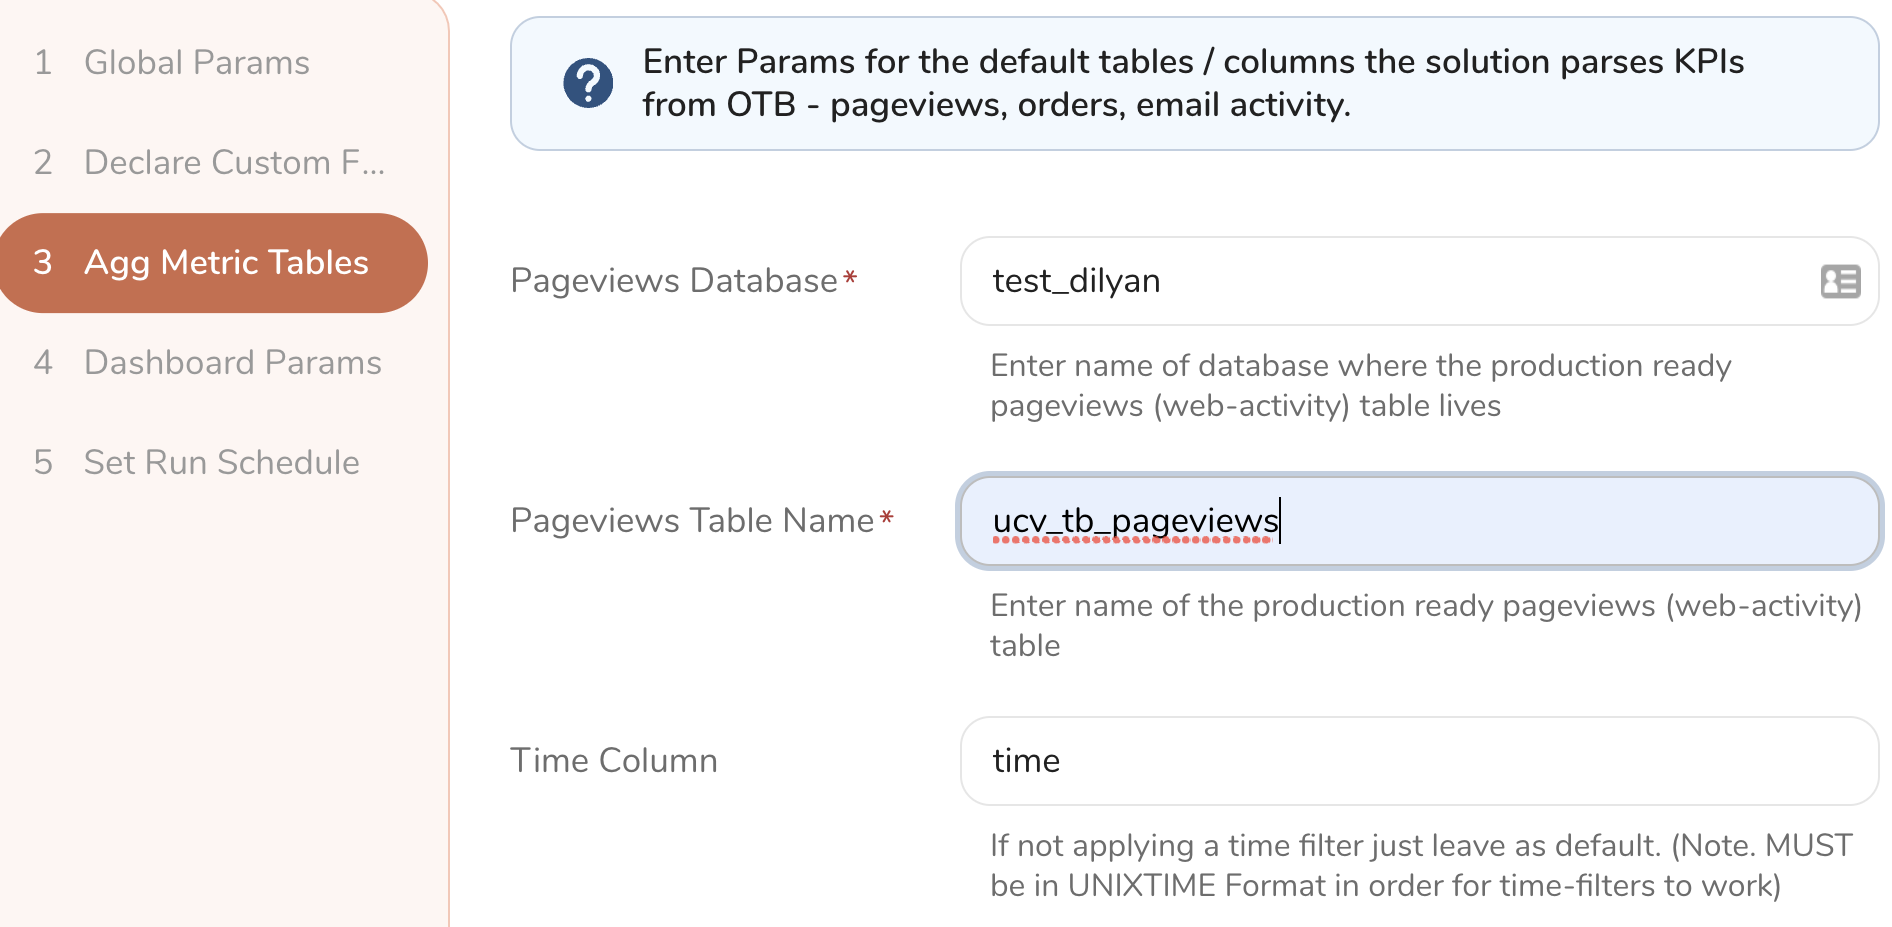
Pageviews Database
 Transactions Database
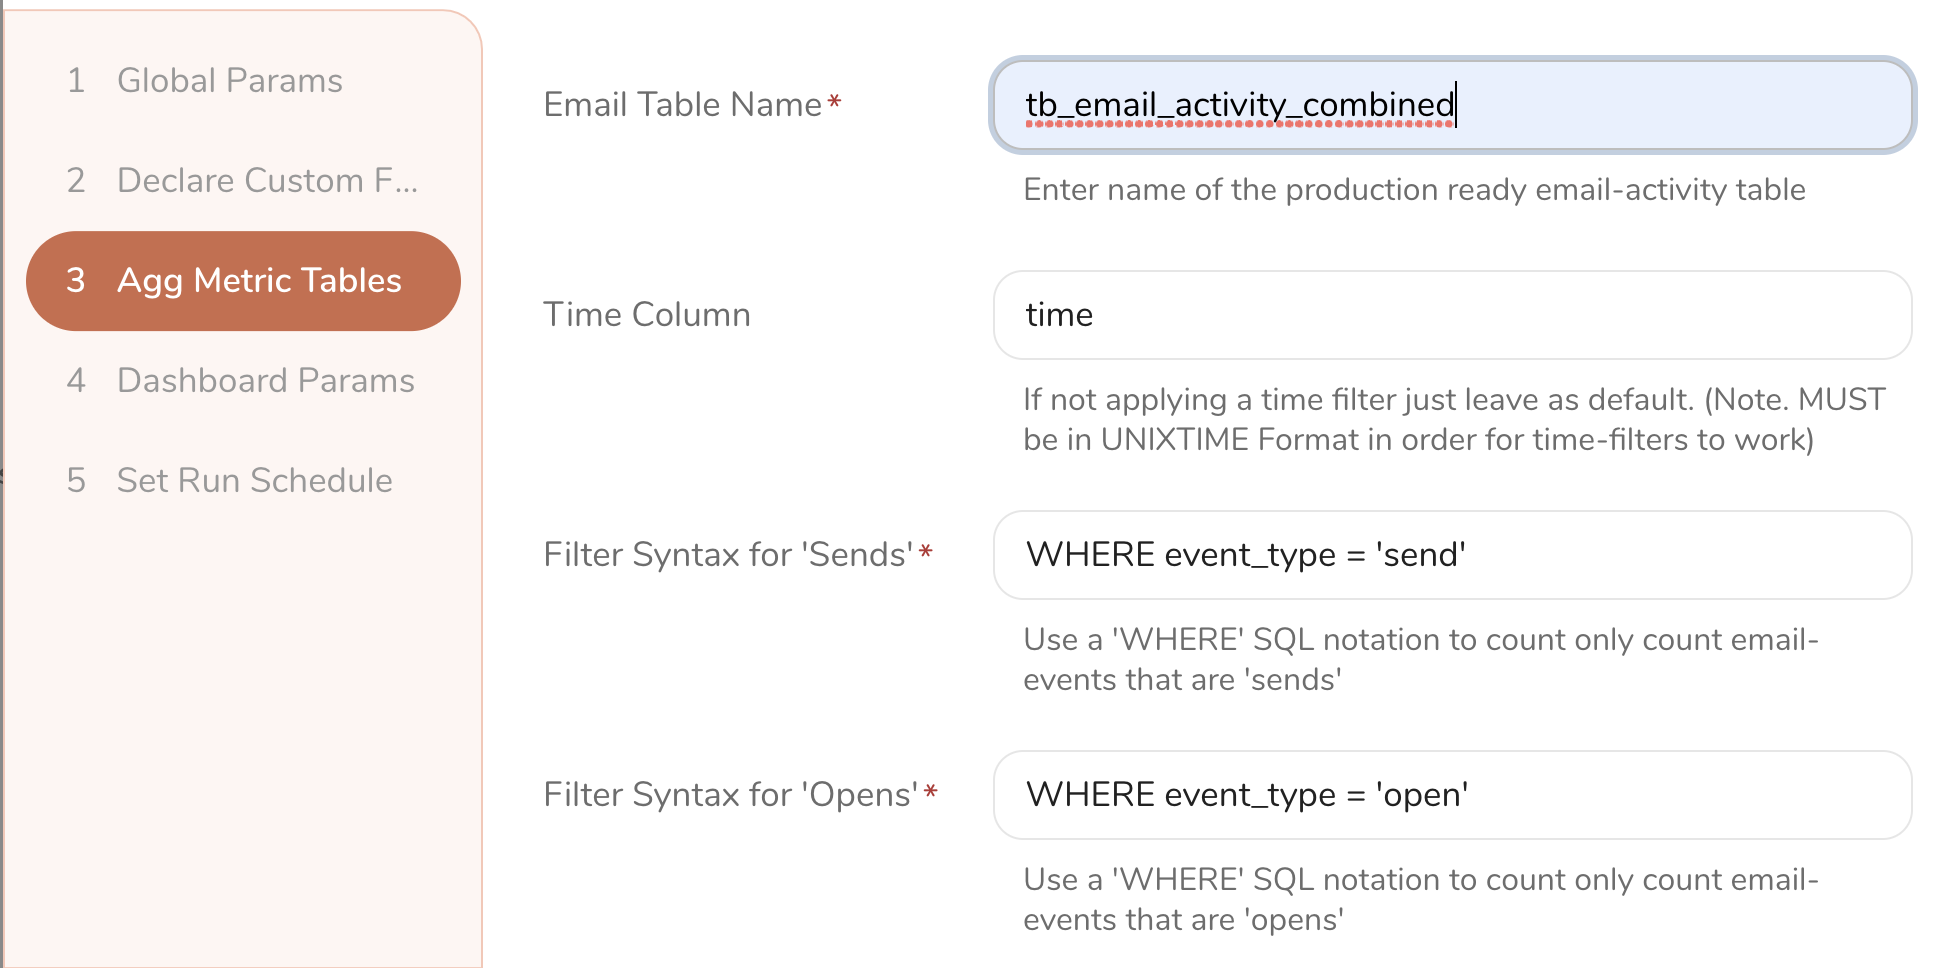
Email Activity Database
1 of 3

1 of 2
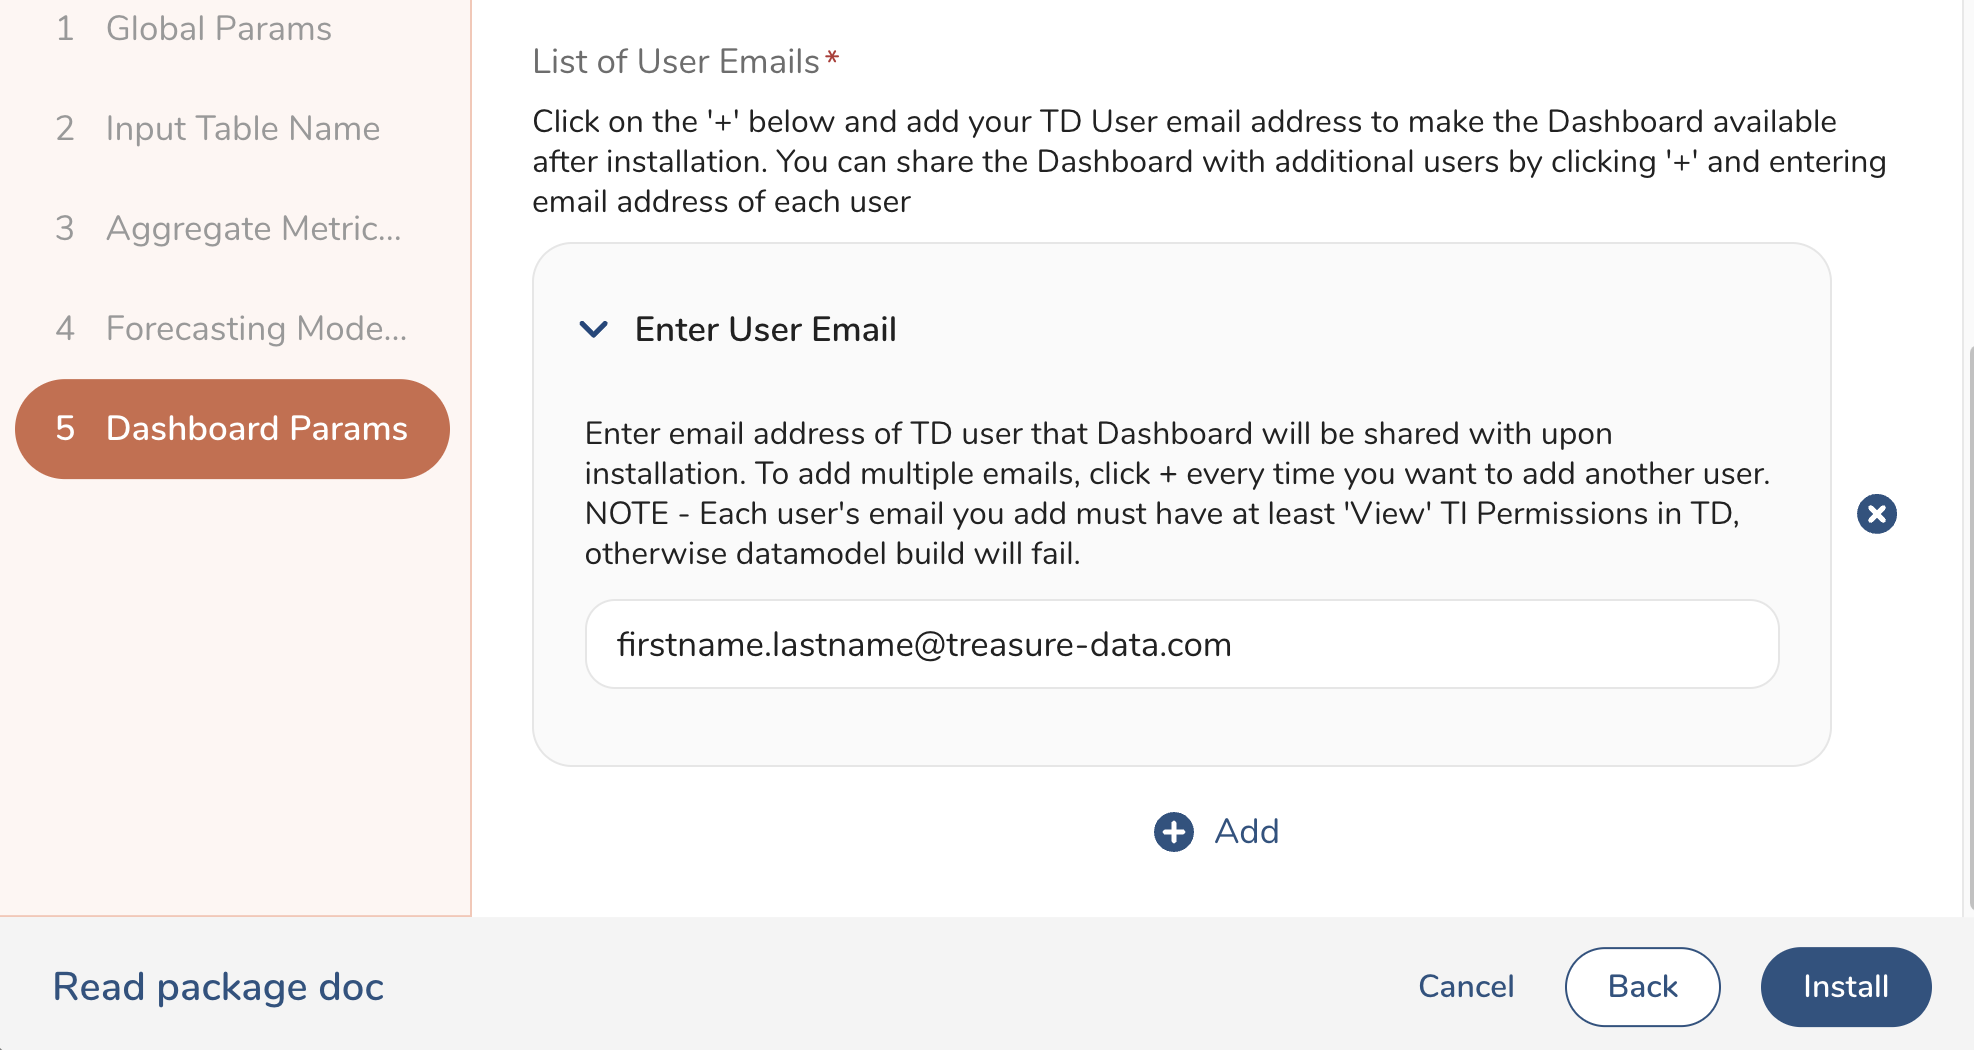
Provide a list of emails of TD users who should have access to the dashboard after package installation.

1 of 2
You can opt to schedule the dashboard refresh on a daily, weekly or any other custom schedule. You can also decide to skip scheduling the solution during installation and do that later by locating the installed project and entering the scheduling parameters in the main segment_analytics_launch.dig file. 
After you fill out the parameters in the UI for the first five steps, you will be presented with an Install button. Select that and you will be linked to a screen where you can monitor the installation logs. If you get a success message, it means all parameters were accepted and the package was installed successfully in your TD account. If you get an error message, check the Error Logs for more details, and if you cannot determine the reason of the failure, contact TD technical support. 
A successful package installation will trigger a Workflow Run in TD, which might take anywhere between 10 to 20 minutes depending on data volumes and your compute units. You must wait for the Workflow Run to complete before you can explore the output tables and the Segment Analytics Dashboard. If you want to monitor the workflow runs, navigate to Data Workbench > Workflows in the TD Console and search for the segment_analytics_launch workflow. If the workflow is still running, you should see a blue dot under Run History, and if the run was successful you will see a green dot. If the workflow throws an error, you will see a red dot and you can go explore the Error Logs and contact TD support for help. 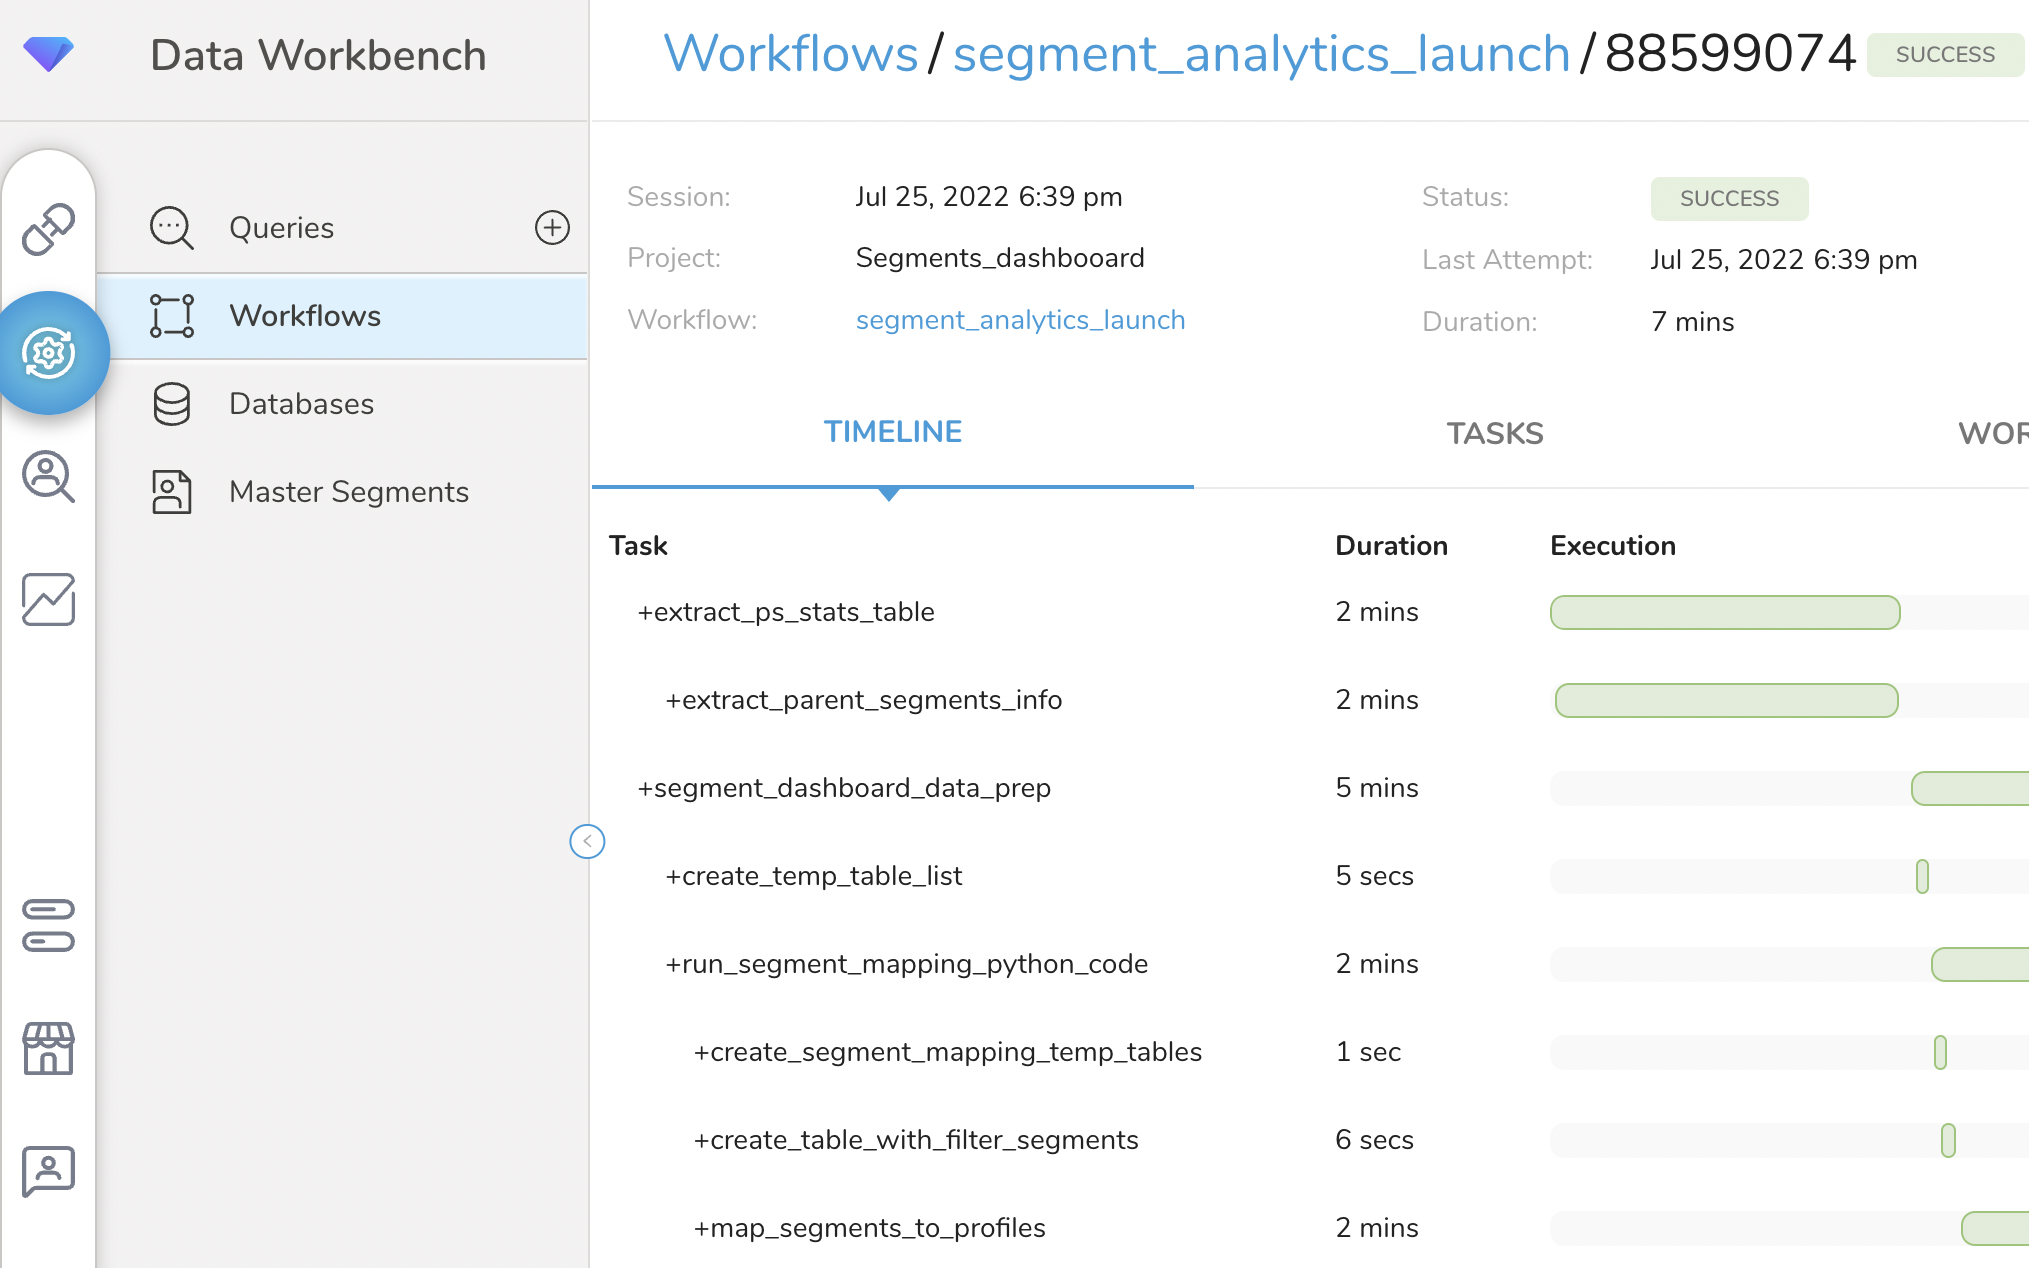
The workflow is set-up, so that the end user only needs to configure the .yml files in the config\ folder and the config.json file in main project folder and the Workflow can be ran to execute end-to-end code automatically. In fact, these files are automatically configured for you during the Package installation steps above, as the parameters you are entering in the UI will be dynamically populated in the proper lines inside the yml and json config files.
However, you can modify these parameters after installation manually when further customization of the solution is needed to fit additional data context and use cases that might not be covered by the OTB configuration. The details on how to configure each yml or config file are as follows:
After installation, manual customizations are ONLY recommended for technical users with some experience with DigDag and SQL/Python. If you do not have such resources available, contact TD support and we can help customize some of the code to your needs, as possible.
config/input_params.yml - Controls important parameters which are often applied globally across most of the data sources and processes in the workflow.
########################## GLOBAL PARAMS ############################

project_prefix: segment_analytics #all output tables and project sub-workflows will start with this prefix
sink_database: ml_dev

######################## FILTER PARAMS ##############################

filters:
  v5_flag: 1, 0                         #'1' - will only scan segments in V5, 0 - only in V4
  ps_to_include: 'ml_|test'             #use lower letter REGEXP notation to only scan selected Parent Segments that include 'ml_' in their name (leave blank to scan all)
  folders_to_include: 'rfm|nba|next'    #use lower letter REGEXP notation to only scan selected Audience Studio Folders that include 'rfm OR nba OR next' in their name  (leave blank to scan all)
  segments_to_include:                  #use lower letter REGEXP notation such as 'segment_name|segment_name_2|segment_name_3' to only scan selected Segments (leave blank to scan all)
  apply_time_filter: 'yes'              #yes - applies time filter to aggregate metrics tables
  time_filter_type: TD_INTERVAL         #Use TD_TIME_RANGE to specify fixed start/end dates OR 'TD_INTERVAL' to lookback days/weeks/months from now
  time_range_start_date: 2020-11-01     #Defines start date for`TD_TIME_RANGE` use format YYYY-MM-DD
  time_range_end_date: 2222-02-02       #To always end TIME_RANGE at the latest available date, leave default as '222-02-02'. To end on a custom date use format YYYY-MM-DD
  time_interval_start_date: now         #leave default 'now' to start at today's date and lookback using 'lookback period', or change to a custom start_date in YYYY-MM-DD format
  lookback_period: -20M                 #-1M looksback a month, -30d looks back 30 days, - 2w looksback 2 weeks etc. Used only with TD_INTERVAL

############# TABLE PARAMS FOR SOURCE AND OUTPUT TABLES #############

aggregate_metrics_tables: #list of input behavior tables you want to aggregate KPI metrics for
 - metric: email_sends
    agg: count
    agg_col_name: '1' #We use '1' instead of '*' because in some instances we might want to SUM(agg_col_name)
    src_db: ml_dev
    src_table: tb_email_activity_combined
    join_key: td_canonical_id
    unixtime_col: time
    filter: WHERE event_type = 'send'

  - metric: spend
    agg: sum
    agg_col_name: order_value
    src_db: ml_dev
    src_table: tb_transactions_mock
    join_key: td_canonical_id
    unixtime_col: time
    filter:             #Add custom 'WHERE' CLAUSE filter if needed

  - metric: orders_count
    agg: count
    agg_col_name: '1'
    src_db: ml_dev
    src_table: tb_transactions_mock
    join_key: td_canonical_id
    unixtime_col: time
    filter:
config.json - Controls important parameters used by Python Custom Scripting
.pyfiles to create the final JSON for the Datamodel and build and share it via the API.{ "model_name": "Segments_dashboard_v5" (name of datamodel) , "model_tables": [ ] (list of tables to be added to datamodel) , "shared_user_list": [ "dilyan.kovachev+psdemo@treasure-data.com"] (list of users to share datamodel with) , "change_schema_cols": {"date": ["run_date", "event_time"], "text": ["ENTER_NAME"], "float": ["ENTER_NAME"], "bigint": ["ENTER_NAME"]} (list of columns you want to change datatype from raw table to datamodel. Ex. in "date" you provide column names that will be converted to `datetime`) , "join_relations": {"pairs":[] } } (if any joins were required you can add a list of table_name:join_key pairs)
segment_analytics_launch.dig - Runs the main project workflow, that triggers entire project execution end-to-end, including all sub-workflows and queries in project folder.
segment_analytics_scan_parent_segments.dig - Scans the Segment API and extracts all the Parent Segment Names, Folder Names, Audience Segment Names and their corresponding IDs, Populations and Query Rules and stores them in a table in TD. This allows us to dynamically scan this table later when we want to aggregate metrics for a selected set of Segments or Audiences.
Segments_dashboard_data_prep.dig - Reads from the
input_params.ymlfile and executes a list of sub-workflows that will dynamically extract thecanonical_idsof the desired segment populations from Audience Studio, by running thequery_rulesstored in the the Segment API JSON for each Segment, and then aggregating the KPIs defined in the${aggregate_metrics_tables}list in theinput_params.ymlfile. These processes are controlled by the sub-workflows:segments_dashboard_map_segments_to_profiles.dig - Retrieves all the segment names, ids and the query logic that we have selected using our
${filter}parameters in theinput_params.ymland thesegment_analytics_ps_stats table. After that it runs each query to get the list ofcanonical_idsfor each Segment and loops through all the tables in the${aggregate_metrics_tables}list and aggregates the desired metrics by Segment Name, grouping by the extractedcanonical_ids.Segments_dashboard_join_tables.dig - Loops through the final list of aggregates metrics and joins them all in one final output table.
Segments_dashboard_datamodel_create.dig - Creates the data model that powers the Dashboard by reading from the
config.jsonfile.Segments_dashboard_datamodel_build.dig - Updates the existing datamodel or dashboard with the latest data generated by each workflow run.
- segment_analytics_ps_stats - Summary of statistics across all Parent Segments, Audience Folders, and Audience Segments that exist in V5 or V4 in TD account. This table is used to filter out which Audience Segments you want to include in the Dashboard and to present the high-level summary statistics in the TD Account Summary Tab in the Dashboard.
| ps_id | ps_name | v5_flag | folder_id | folder_name | segment_id | segment_name | segment population |
|---|---|---|---|---|---|---|---|
| 24145 | Demos | 1 | 51444 | RFM Models | 12451 | Top Tier | 1,245,000 |
- segments_dashboard_final_metrics_table - Final Table with all segment metrics that will be shown in the Dashboard pre-aggregated by
Segment_Nameand Date.
| event_date | segment name | population | pageviews_total | order_value | email_opens | order_counts |
|---|---|---|---|---|---|---|
| 2022-05-20 | RFM Models | 124500 | 725000 | 34525 | 12451 | 42777 |
The Segment Analytics Dashboard reads from an Insights Model build from the parameters listed in the config.json file. By default, this includes the two tables listed above - segment_analytics_ps_stats and segments_dashboard_final_metrics_table. More tables and metrics can be added on customer request to fulfill additional use case requirements.
 TD Account Parent Segment & Audience Studio Summary
High Level Summary of Counts and Population sizes for Parent Segment, Audience Studio Folders, and Audience Studio Segments in the given TD account.
 Audience Population Metrics
Provides Widgets for KPIs such as Query Logic Changes Tracker, Latest Population by Segment Name, Daily/Weekly Population Growth Tracker etc.
 Web Activity Metrics
Provides Widgets for tracking Total, Unique & AVG Daily/Weekly web-events for each Segment Audience. It also shows the Latest Totals and AVGs of each metric compared by Segment Name. This allows to find Segments that generate a lot more web-engagement for the customer, track how web-activity grows over time and measure the effect of different marketing initiatives on web engagement.
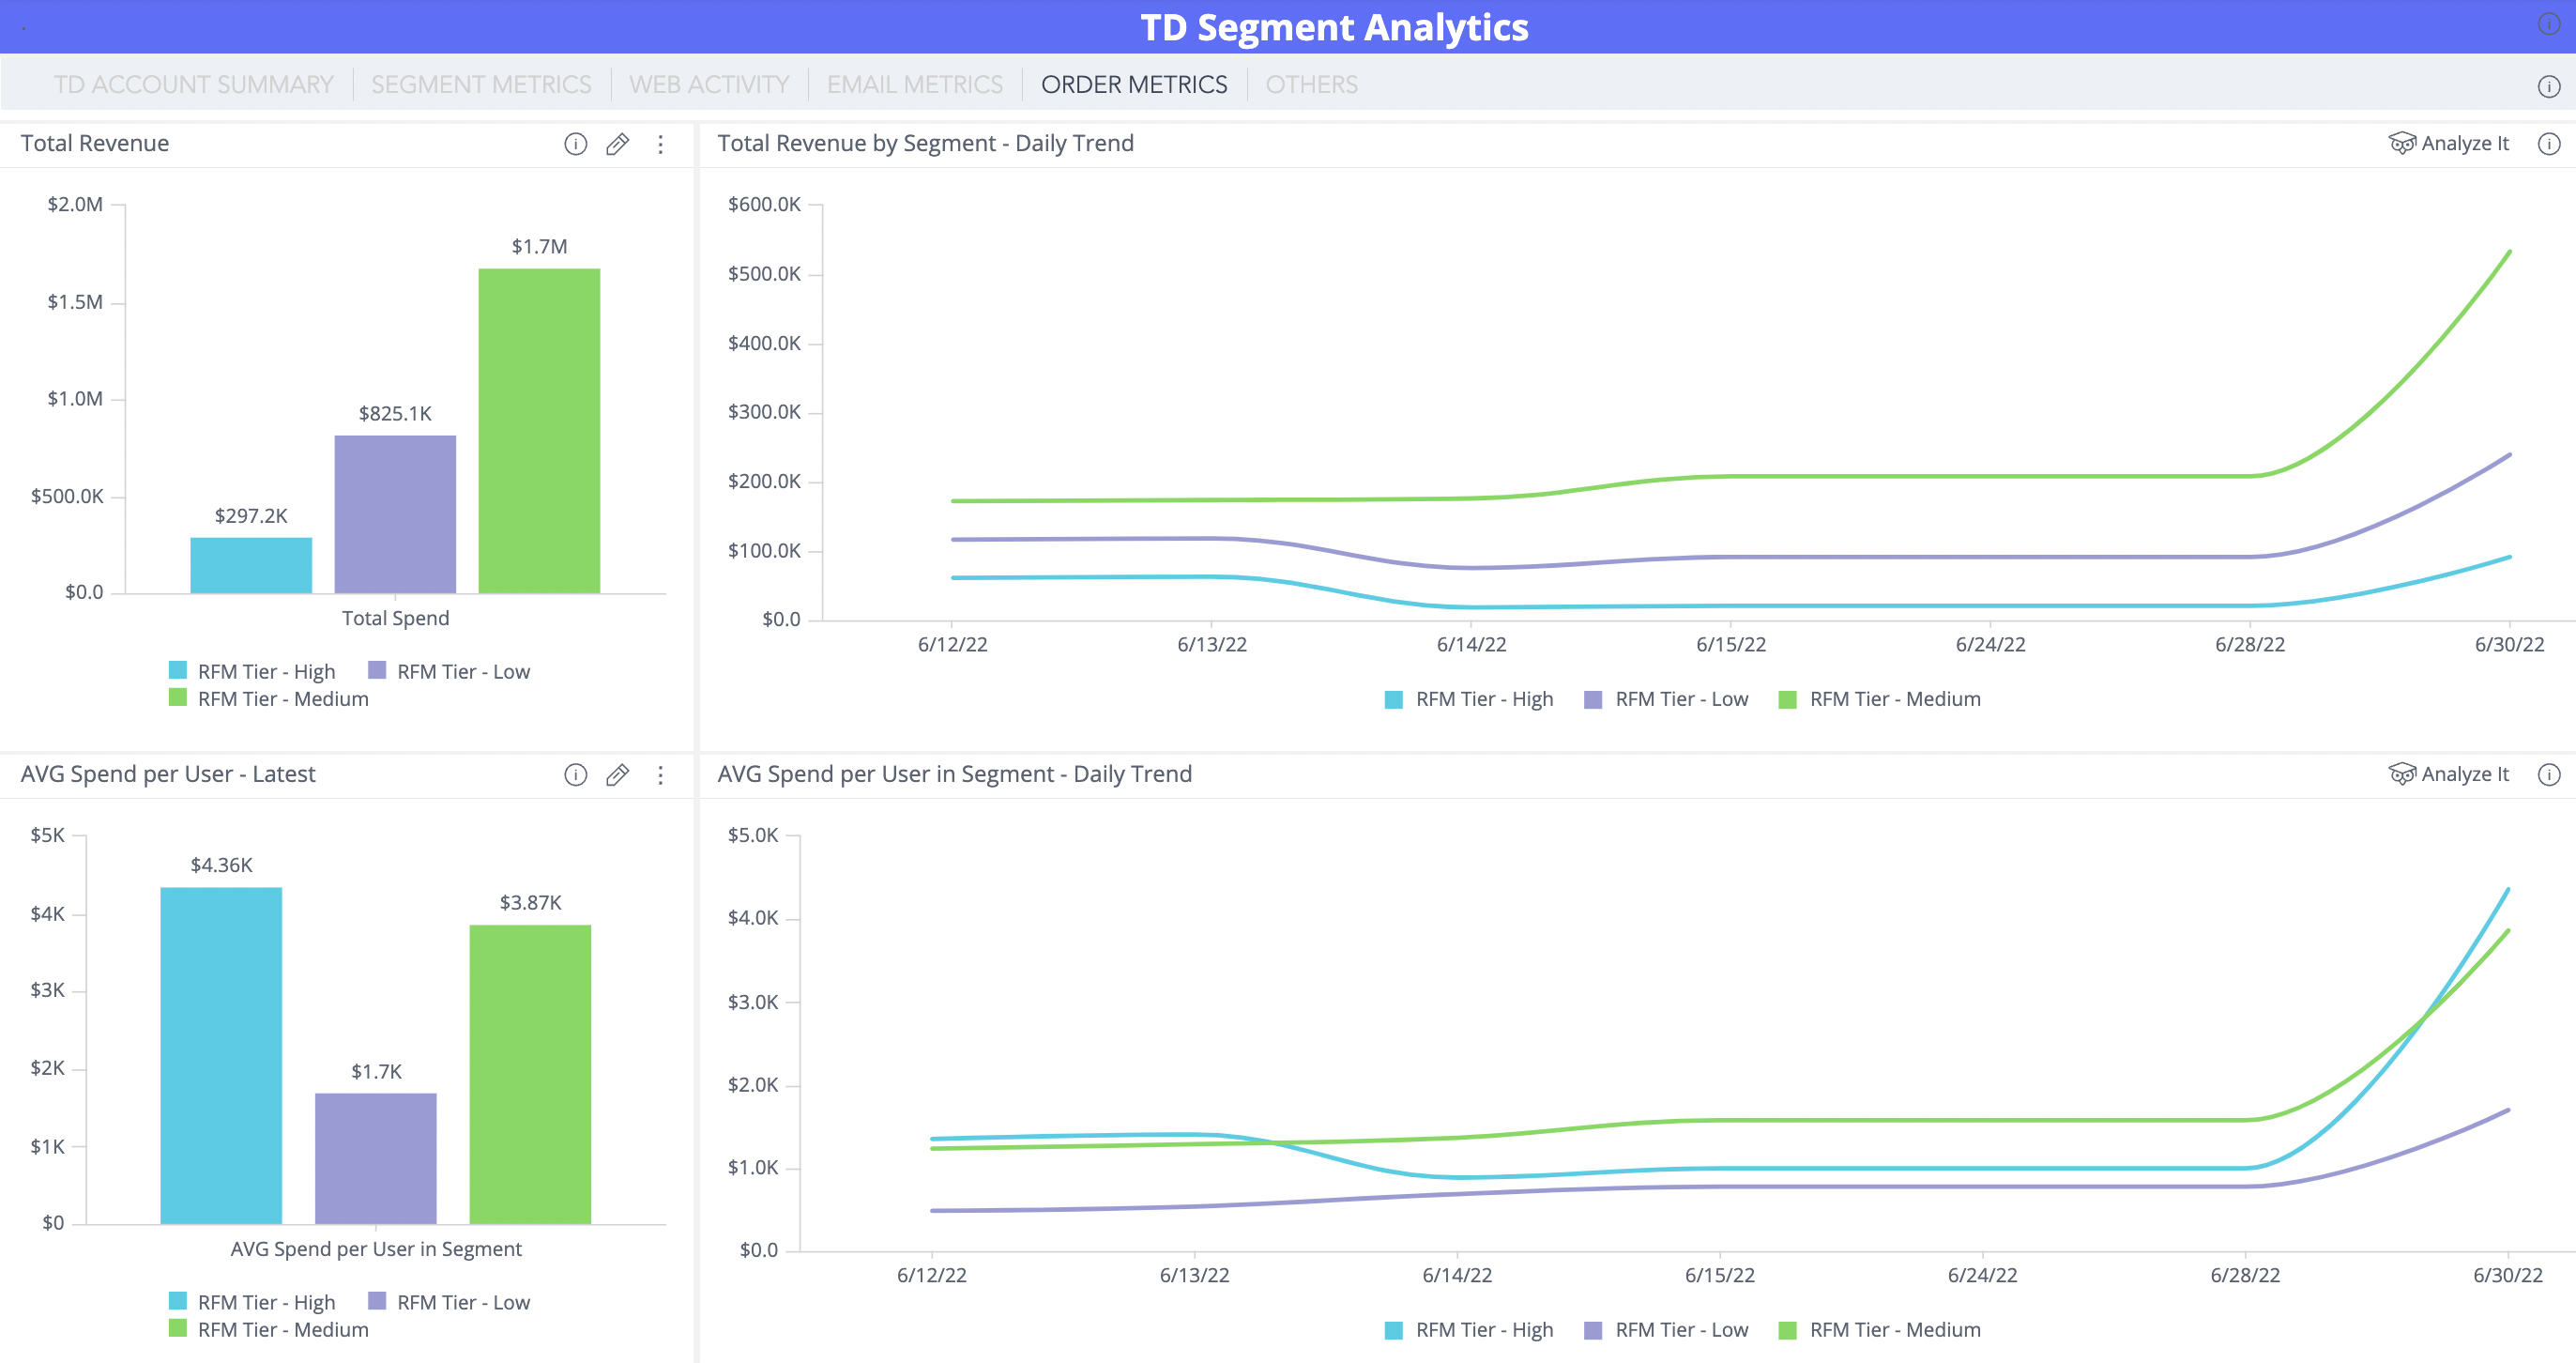 Orders/Sales Metrics
Provides Widgets for tracking Total, Unique and AVG Daily/Weekly Revenue for each segment audience. It also shows the latest Totals and AVGs of each metric compared by Segment Name. This allows to find Segments that generate a lot more sales and revenue for the customer, track how Sales/Revenue grows over time and measure the effect of different marketing initiatives on revenue growth.
 Email Activity Metrics
Provides widgets for tracking Total, Unique & AVG Daily/Weekly email-activity (sends, opens, clicks) for each segment audience. It also shows the latest Totals and AVGs of each metric compared by segment name. This allows to find Segments that generate a lot more email engagement for the customer, track how email activity grows over time.
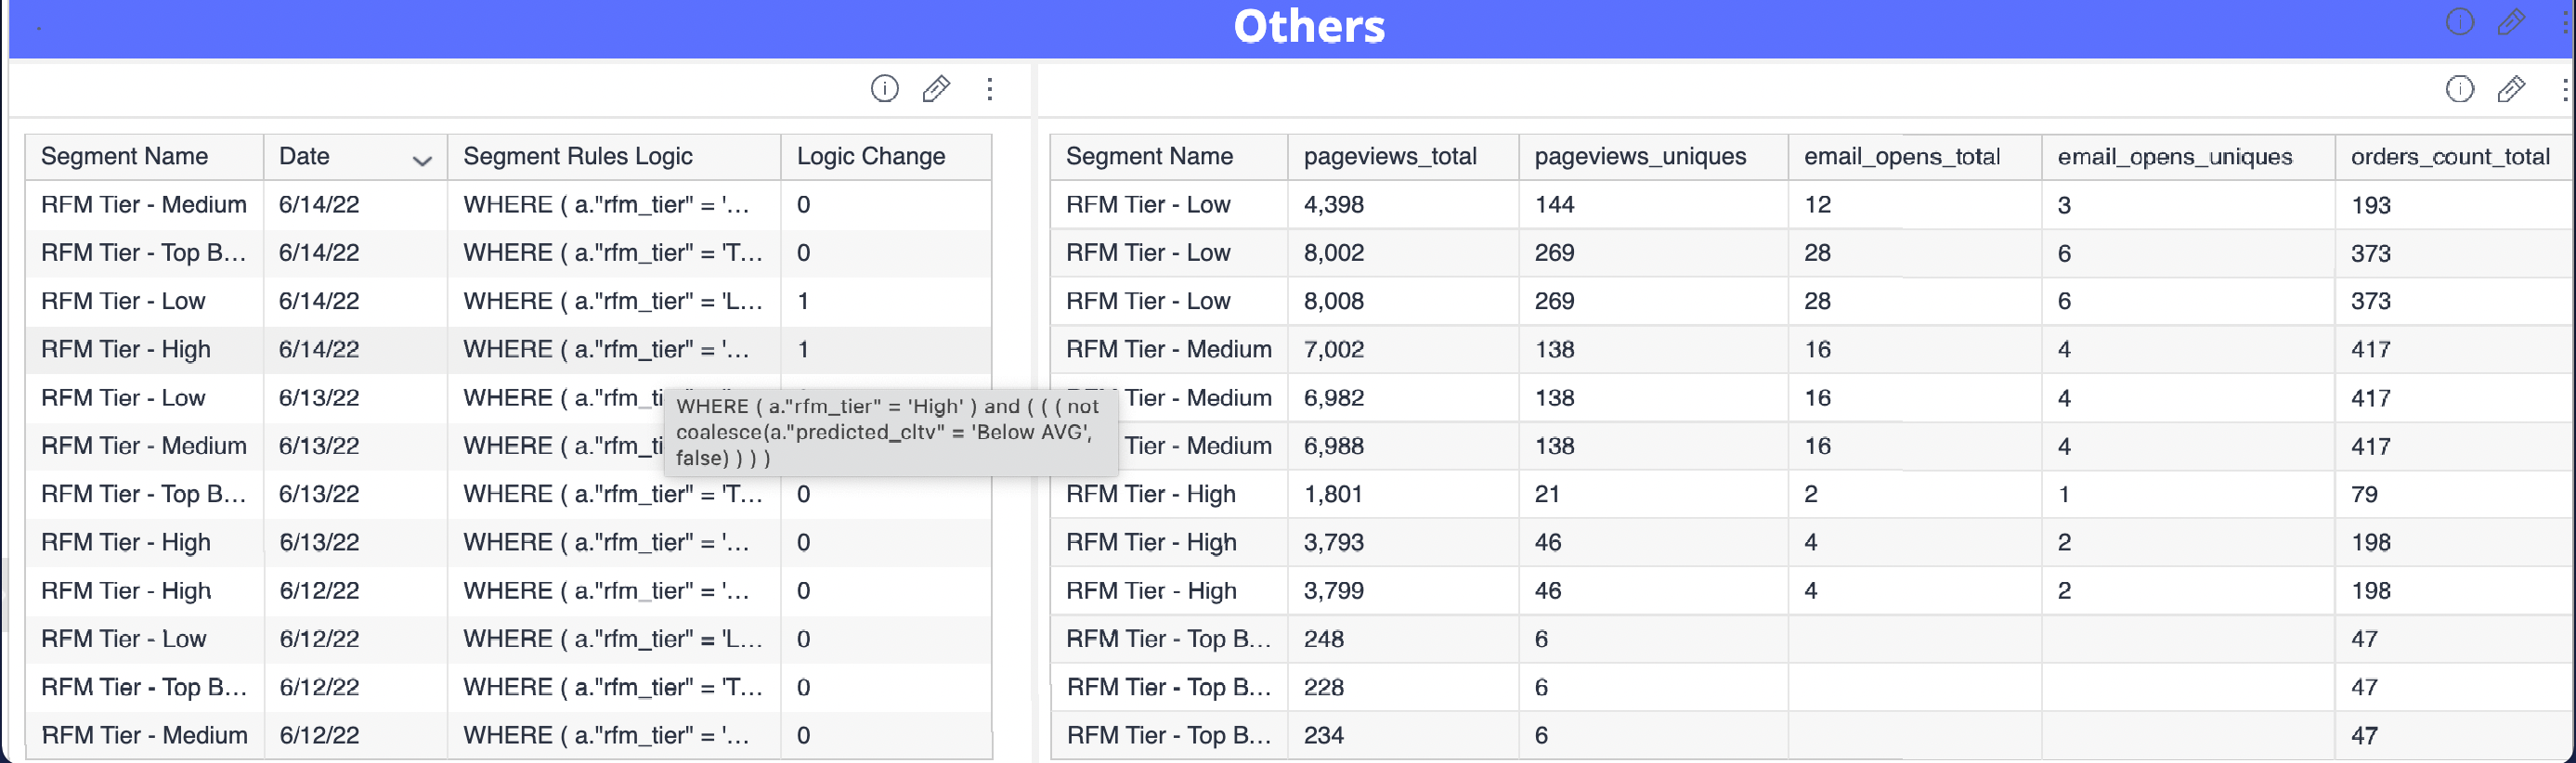 Others
This last widget is reserved for additional custom metrics that can be added in a table format, that might be of use to the customer depending on their input data and use cases. OTB we have included ability to detect Audience Query Logic change and visualize the actual Query Change Syntax as well as compare Segments metrics by **Totals vs Uniques**. Data Engineers / Analysts who are comfortable with WOrkflows and Treasure Insights can easily add more custom metrics to this dashboard by using the Workflow config files and custom SQL queries.
1 of 6
sql/filter_segments.sql - This reads the parameter
${filters}from theinput_params.ymlconfig file and selects only the IDs and names of the parent segments, folders, and audiences that the end user wants to make available in the final dashboard for analysis.AND REGEXP_LIKE(lower(ps_name), '${filters.ps_to_include}') AND REGEXP_LIKE(lower(folder_name), '${filters.folders_to_include}') AND REGEXP_LIKE(lower(segment_name), '${filters.segments_to_include}')sql/segments_dashboard_get_query.sql - This reads from the
segment_analytics_segment_profile_mapping_temptable and extracts the SQL Query Syntax behind building each audience in the Audience Studio in order to get thecanonical_idsthat belong to each Audience and inserts the IDs into thesegment_analytics_run_querytable along with the corresponding Audience Name, ID flag, and population counts.sql/segments_dashboard_metrics_agg.sql - This loops through the
${aggregate_metrics_tables}list defined in theinput_params.ymlconfig file and calculates the total, avg, and unique aggregate metric for each Audience ID saved earlier in thesegment_analytics_run_querytable. Each aggregate metric is then saved as an individual temp table with thesegment_analytics_+metric_namenaming convention (For example, segment_analytics_pageviews_total).sql/final_metrics_table.sql - This query then joins each of the
agg_metric_temp_tablesinto one final table -segment_analytics_final_metrics_table. This is the table that contains all the important KPIs associated with each Audience Segment that the user defined earlier in the${filters.folders_to_include},${filters.segments_to_include}parameters. This table powers the final Segment Analytics dashboard widgets and filters.
After you get the success message after package installation, you can locate the installed Workflow by going to the Console UI and navigating to the Data Workbench > Workflows tabs on the left. The name of the project should be the same as the name that you gave it in the Project Name tab during package installation. Use this documentation as a guide on how you can modify the input_params.yml file to customize future outputs to additional Segments that you might want to include in your analysis or additional KPIs you want to add to the ${aggregate_metrics_tables} list.
Find the installed workflow project using the guide from the paragraph above and identify the segment_analytics_launch.dig file, which is the main project file that runs the entire end-to-end solution. Select Launch Project Editor on the top right in the console and then select Edit File on bottom right. At the very top of the file, you might see an empty section as such:
###################### SCHEDULE PARAMS ##################################To schedule the workflow, add syntax below, so the final syntax looks as such:
###################### SCHEDULE PARAMS ##################################
timezone: UTC
schedule:
  daily>: 07:00:00
The above example will automatically run the workflow every day at 7:00 am UTC time. For more scheduling options, refer to the DigDag documentation at Link.
No. Output Tables, Workflow or Dashboards created by the package will not be deleted if the package is uninstalled.
Contact your TD representative and they will be able to dedicate an Engineering resource that can help guide you through the installation process and help you with any troubleshooting or code customization, if needed.