Auto-Segmentation - how to use machine learning to generate customer segments with deeper insights for increased turn-around and improved ROI.
Auto-Segmentation is essentially a marketing application of the K-Means clustering machine learning model. It works fairly simply — you feed the ML model all the data you have about your customers, choose how many groups you would like, and the model assigns a cluster label for each customer you feed in. For example, if I have 1000 customers and I want to devise three different marketing strategies, I would use an Auto-Segmentation model to divide the users into three separate groups, so I can design an optimal marketing plan for each group. This enables end users such as marketers, campaign managers, business strategists to achieve some of the following business outcomes:
- Improve targeted marketing and personalization - having several distinct audiences allows marketers to customize and apply different marketing techniques to each group
- A/B testing — compare performance across groups and discover which types of audiences perform best for various marketing campaigns and conversion goals.
- Improve ROMS / Marketing KPIs – adjust marketing spend toward the audiences that perform better over time to achieve higher return on marketing spend and improve other KPIs important to your business.
- Understand your customers better – analyze the distinct characteristics (attributes and behaviors) of each auto-segmentation cluster to discover the repeatable patterns and the business meaning that each group is defined by. This enables a deeper dive into each important customer group, rather than analyzing your customer base as a whole.
While there are different methods of performing auto-segmentation, the concept behind all these methods is fairly similar. Data points (customers) are grouped based on similarity and the ML model aims to get the most similar personas into each cluster and at the same time ensure that the groups formed are as different from each other as possible in terms of their combined characteristics. In other words, K-means aims to find the clusters that are most homogeneous within themselves and most different from each other. For example, if the auto-segmentation generates three distinct groups of customers, there is statistical certainty the customers in Group 1 will be most similar to each other, and less similar to customers in Groups 2 and 3.
Our goal at Treasure Data is to enable our customers to gain as much intelligence and business value from their data as possible in a way that is customized to their specific use cases and targeted outcomes. Thus, we have modified our approach to Auto-Segmentation to better serve the needs of marketing teams and business users by allowing them to pick a list of user characteristics they want to prioritize for the ML model when discovering audiences.
At Treasure Data, we set out to make a segmentation model that is a little more controllable and hopefully much more useful for marketers on our platform. Typically, marketers already have some idea of the different kinds of customers to target. The idea here is to simply nudge the Machine Learning model to prioritize a set of characteristics during the grouping process.
After months of testing, we found a simple solution — to just scale values of more relevant characteristics or features up. Mathematically, by scaling a feature up, it makes a clustering algorithm more sensitive to it. Take this simple but extreme example where we try to split four data points into two groups based on two characteristics, amount spent, and whether they are based in the US. (Note: The features are Min-Max scaled to range between 0 and 1. Features should always be scaled in some way when fed into any distance-based model, so feature ranges don’t bias the outcome.)
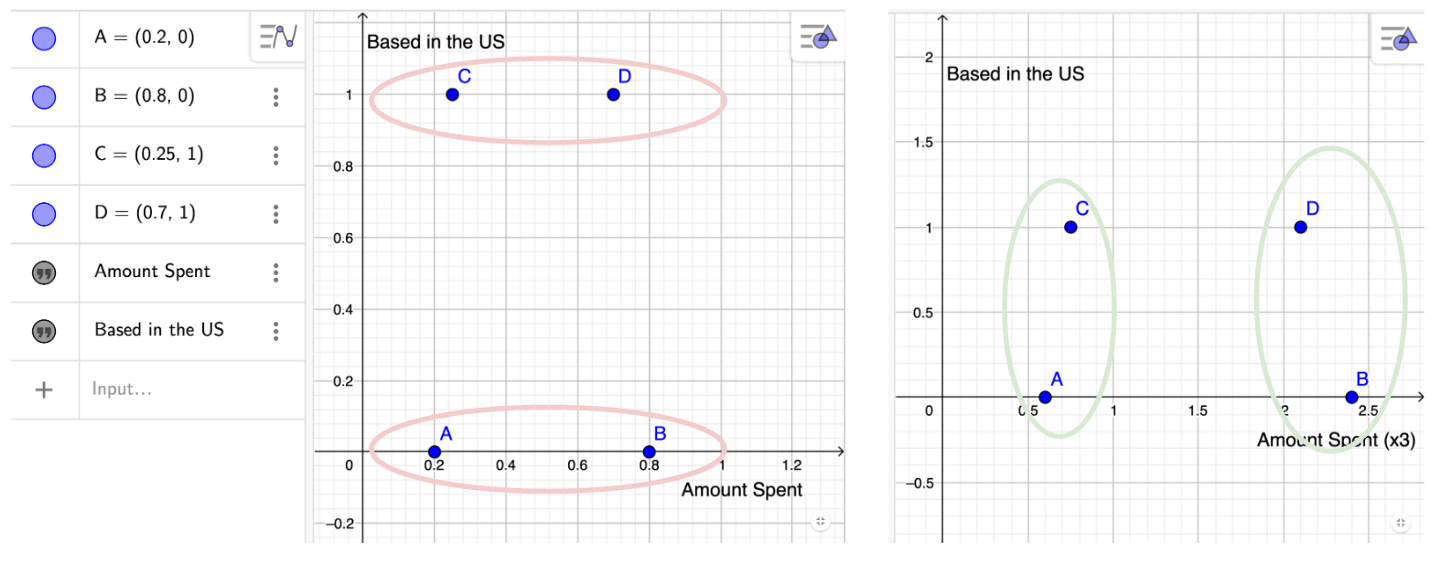
Dividing 4 points into two groups based on distance. Panel on the left shows the original data values. Left: original input data. Right: amount spent is multiplied by a factor of 3.
Now, by simply multiplying the value of the amount spent by an arbitrary positive integer, we see how the relative distance between points change, splitting the data by a more “relevant” feature. In the oversimplified example shown previously, only after multiplying the amount spent by 3 (see that values along the y-axis stay the same), the groups end up being split via higher spend vs lower spend, opposed being split based on whether the customer is based in or out of the US.
Using simulated test data, we ran two versions of our auto-segmentation model: one fully unsupervised, and one with RFM (recency, frequency, monetary) and a customer’s next best channel prediction prioritized. We then measure the information gain of all features (i.e. how much a feature contributes to the separation of groups) and the resulting bar graphs comparing the two models.
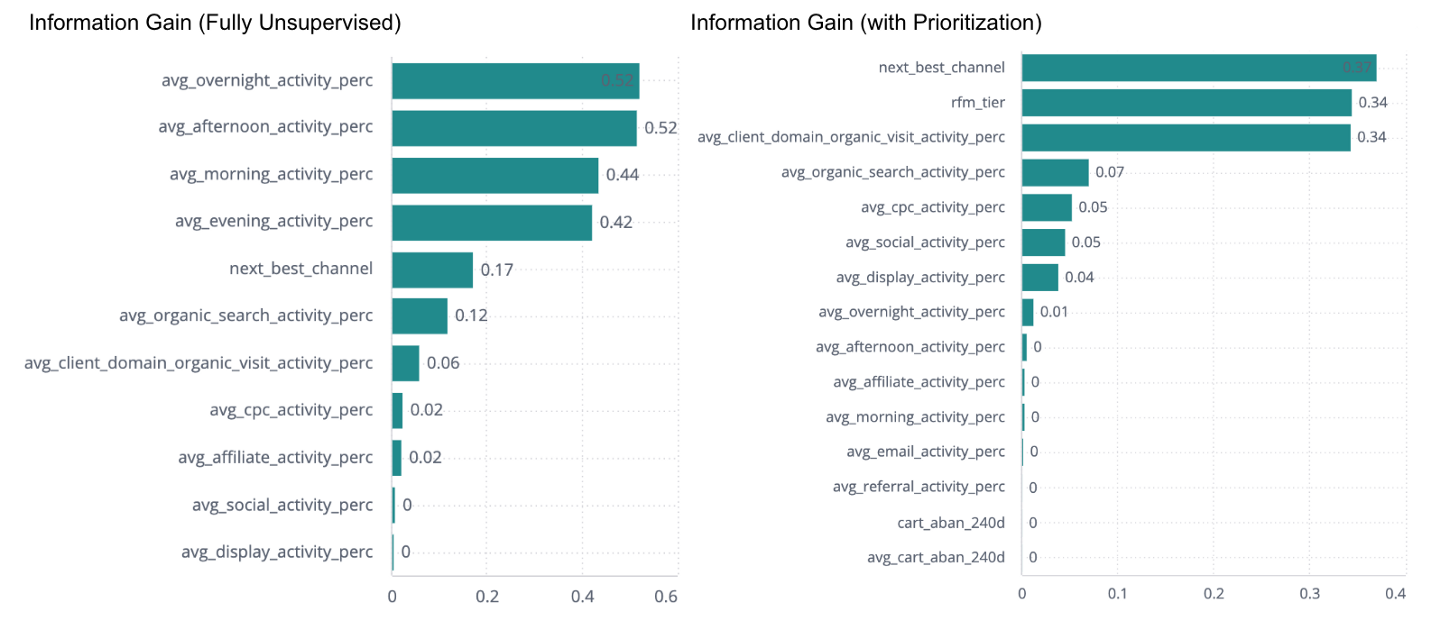
<center>A sample output from two outputs of Treasure Data’s Auto-Segmentation dashboard, comparing the input features’ Information Gain with and without prioritization.
The typical Beeswarm plots that depict Shapley Values are extremely useful, but can be memory and computationally intensive. To circumvent this, we save the average high and low Shapley values per feature per cluster for analysis. In the example that follows, showing the Shapley values for a specific cluster, we see users in this cluster can be characterized by high recency (which concurs with the third-highest feature counting the days since last pageview), and having their last channel being campaign search.
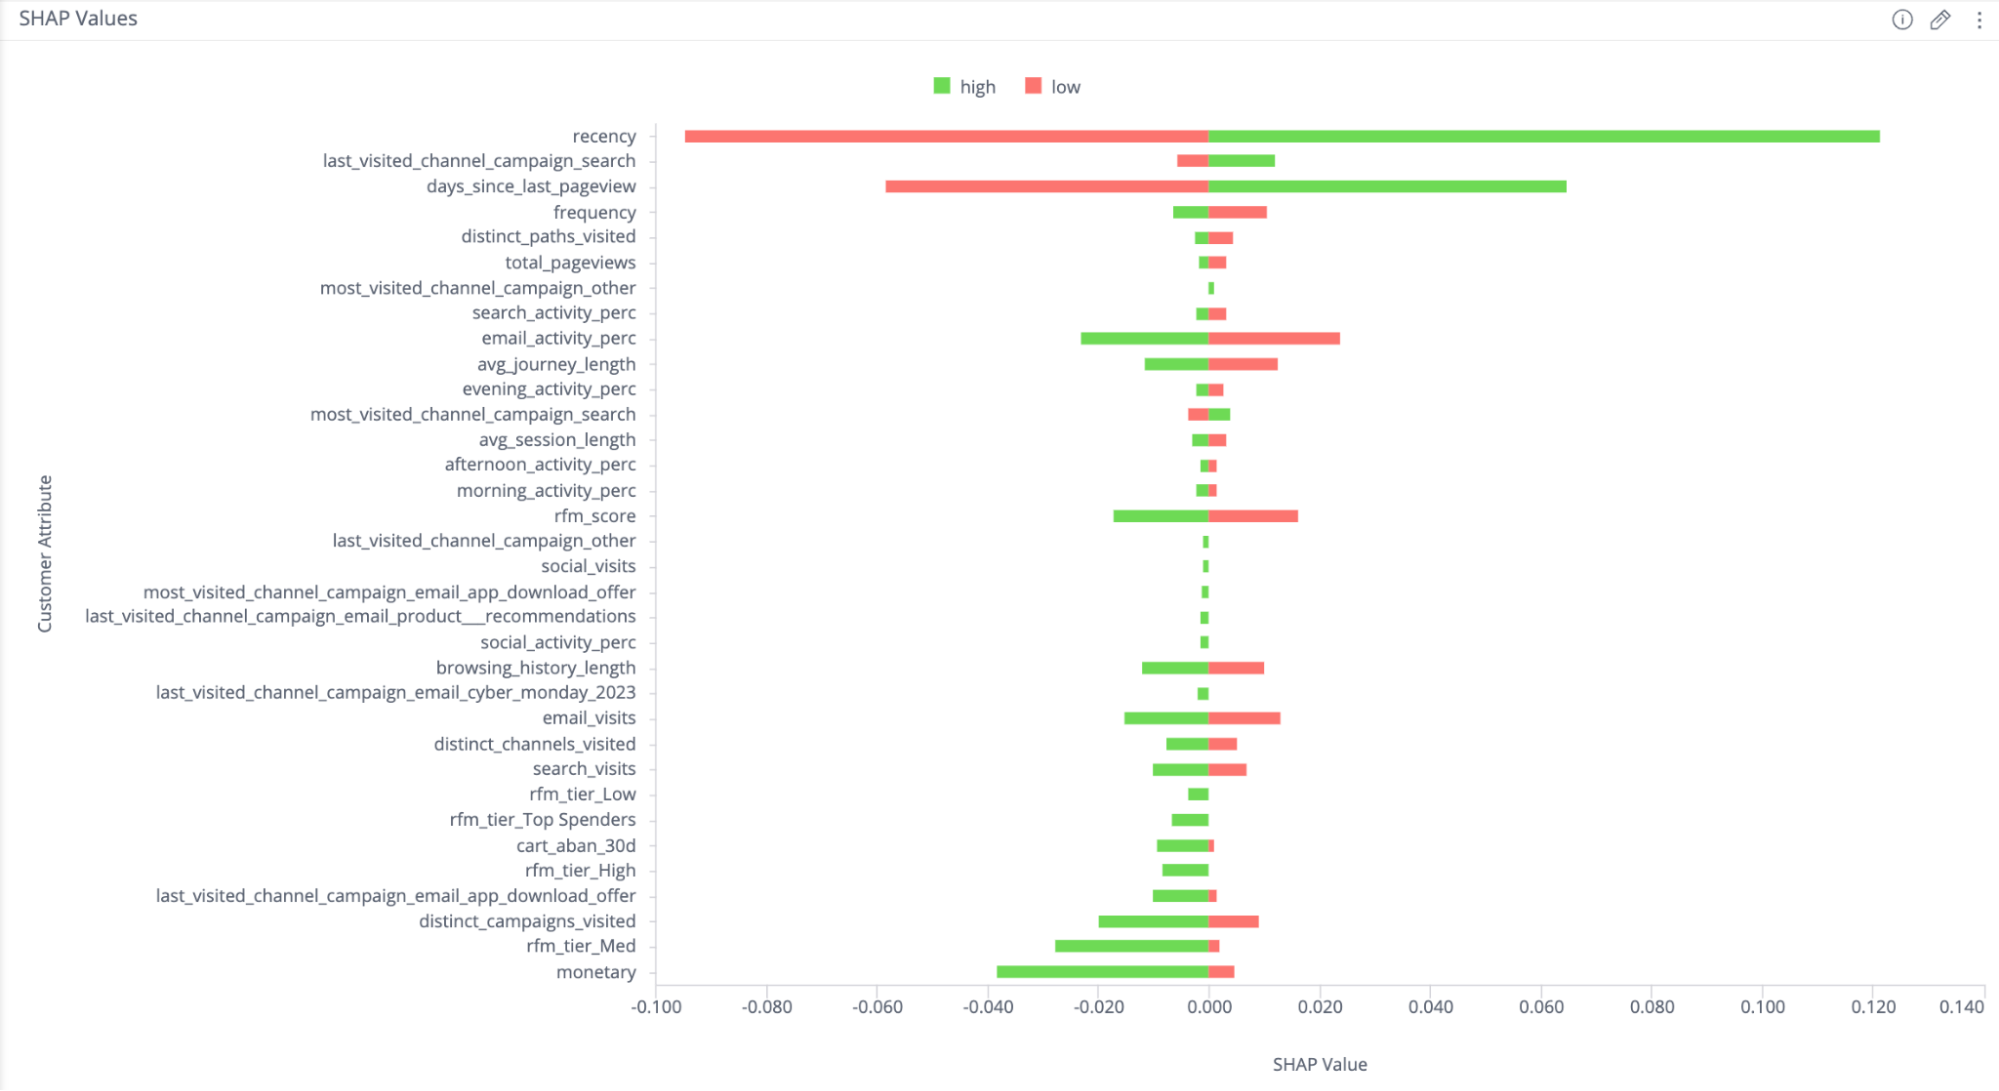
In thinking about what would be most useful for marketers in context, we realized that not only would it be good to see what the most important or distinguishable features or characteristics are, but also the ranges of values of said features within each group.
Relative feature compactness basically measures the relative standard deviation of a feature across each cluster and the entire input dataset. The intuition behind this is if the standard deviation of a feature is much smaller in a single cluster compared to the population, that feature is more likely able to be used to characterize that cluster. For example, if CLTV (Customer Lifetime Value) is distributed fairly evenly from 0–100, it would have a relatively large standard deviation. If Cluster 1 has a CLTV range of 80–100, it would have a relatively lower standard deviation compared to the population, so CLTV might be a good descriptor of the cluster, i.e. Cluster 1 has customers with high lifetime value.
Relative feature compactness can be then ranked per each new group, forming an output similar to the following graph:
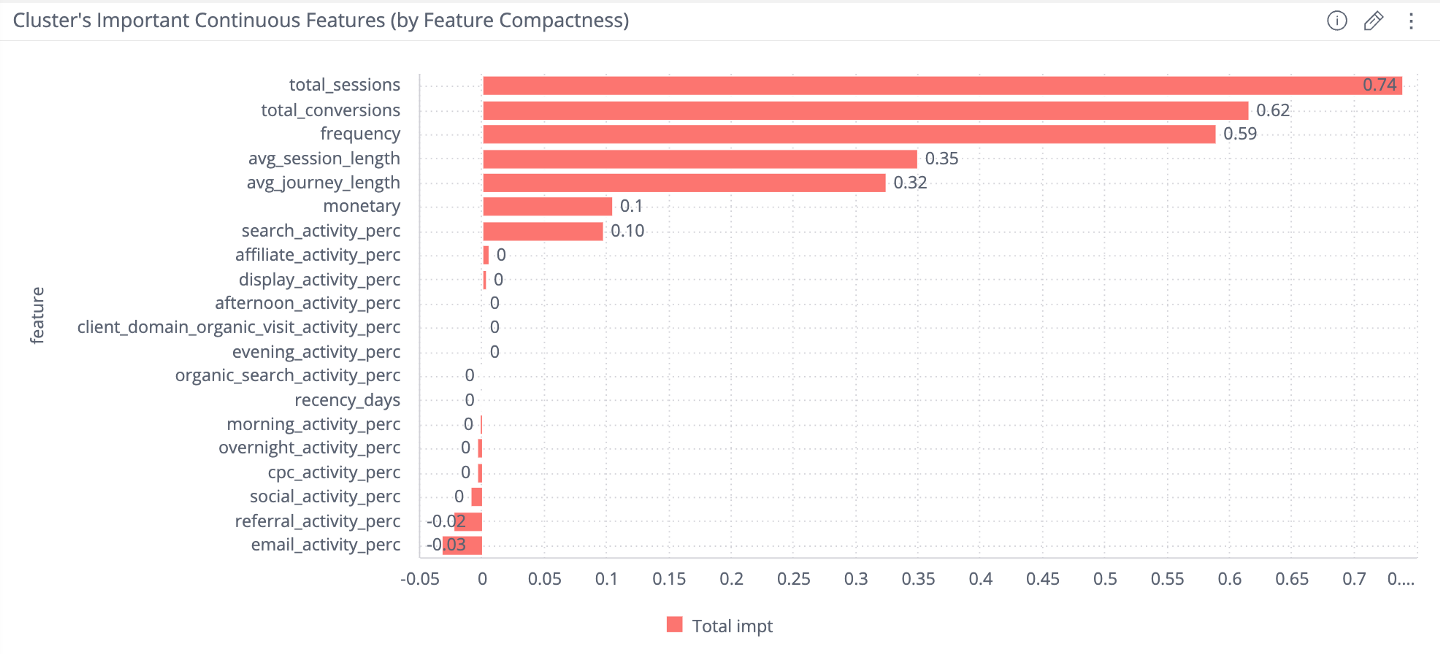
<center>A sample output from two outputs of Treasure Data’s Auto-Segmentation dashboard, showing relative feature compactness for a single group output by the Auto-Segmentation model.
Combining the ranked feature compactness with any visual that represents the distribution of the feature amongst the different groups produced by Auto-Segmentation makes it easier to characterize each group. For example, the following screenshot shows the distribution of the top two most relatively-compacted features for cluster_3. A meaningful description of this cluster could then be something akin to: customers with 8–10 total sessions and more than 6 conversions.
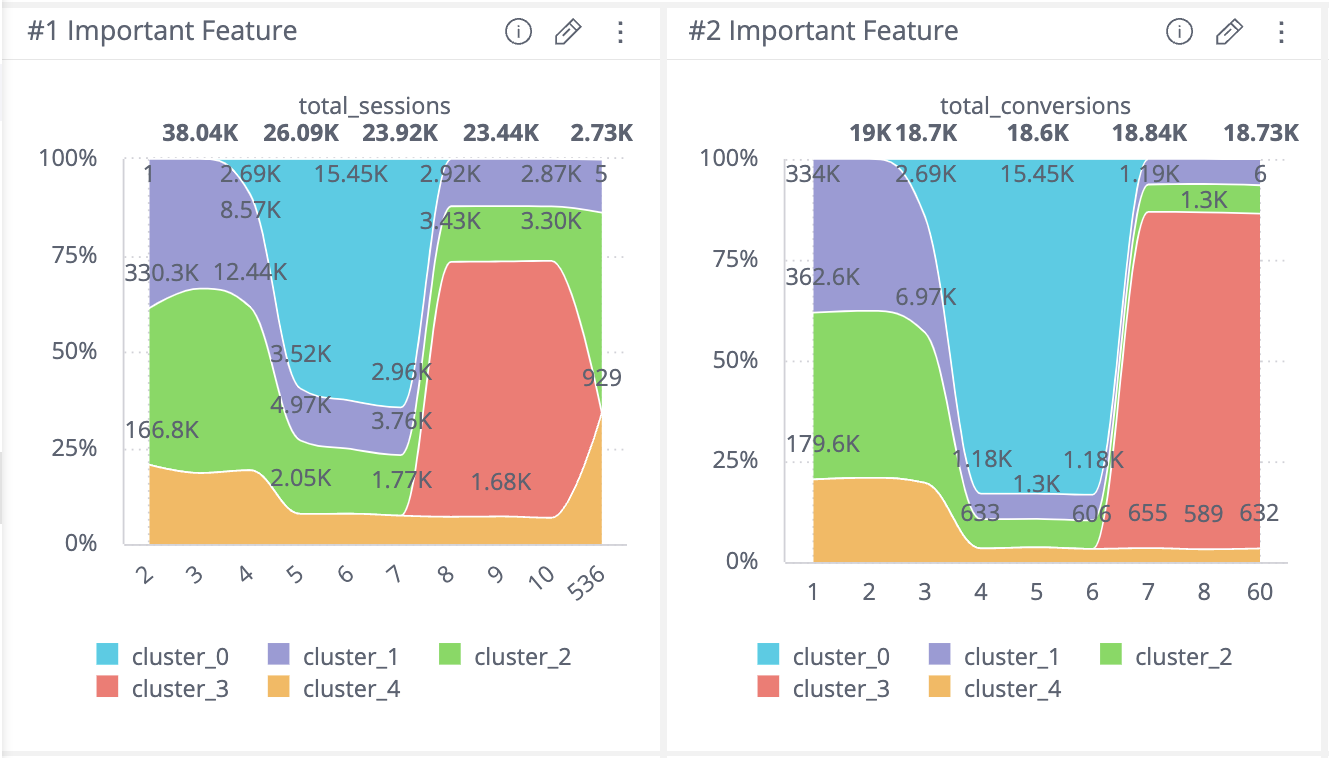
<center>A sample output from two outputs of Treasure Data’s Auto-Segmentation dashboard, showing a stacked proportion histogram for two input features.
Here we took a dive into Auto-Segmentation, its out-of-the-box limitations, and two “areas of improvement” we have implemented at Treasure Data: the ability to prioritize segmentation features, and the ability to characterize segments using relative feature compactness. While these two new tweaks to Auto-Segmentation are mathematically more simplistic compared to other metrics and methods used in the Machine Learning space, it makes the evaluation and interpretation of Auto-Segmentation in a marketing context so much easier and user-friendly. As we strive to improve our strategies and offerings, I find that it helps to take this context-first approach and iterate from a user-first perspective.